
Mar 16, 2025
Netherlands Wall Clocks Imports
Wall clocks imports into the Netherlands expanded markedly to 9.3M units in 2024, growing by 13% on 2023 figures. The total import volume increased at an average annual rate of +1.5% over the period from 2014 to 2024; the trend pattern remained consistent, with somewhat noticeable fluctuations being recorded throughout the analyzed period. The most prominent rate of growth was recorded in 2022 when imports increased by 20%. Over the period under review, imports reached the maximum in 2024 and are expected to retain growth in the near future.
In value terms, wall clocks imports totaled $38M (IndexBox estimates) in 2024. Overall, total imports indicated a modest expansion from 2014 to 2024: its value increased at an average annual rate of +1.6% over the last decade. The trend pattern, however, indicated some noticeable fluctuations being recorded throughout the analyzed period. Based on 2024 figures, imports decreased by -15.7% against 2021 indices. The pace of growth was the most pronounced in 2020 with an increase of 22% against the previous year. Imports peaked at $45M in 2021; however, from 2022 to 2024, imports remained at a lower figure.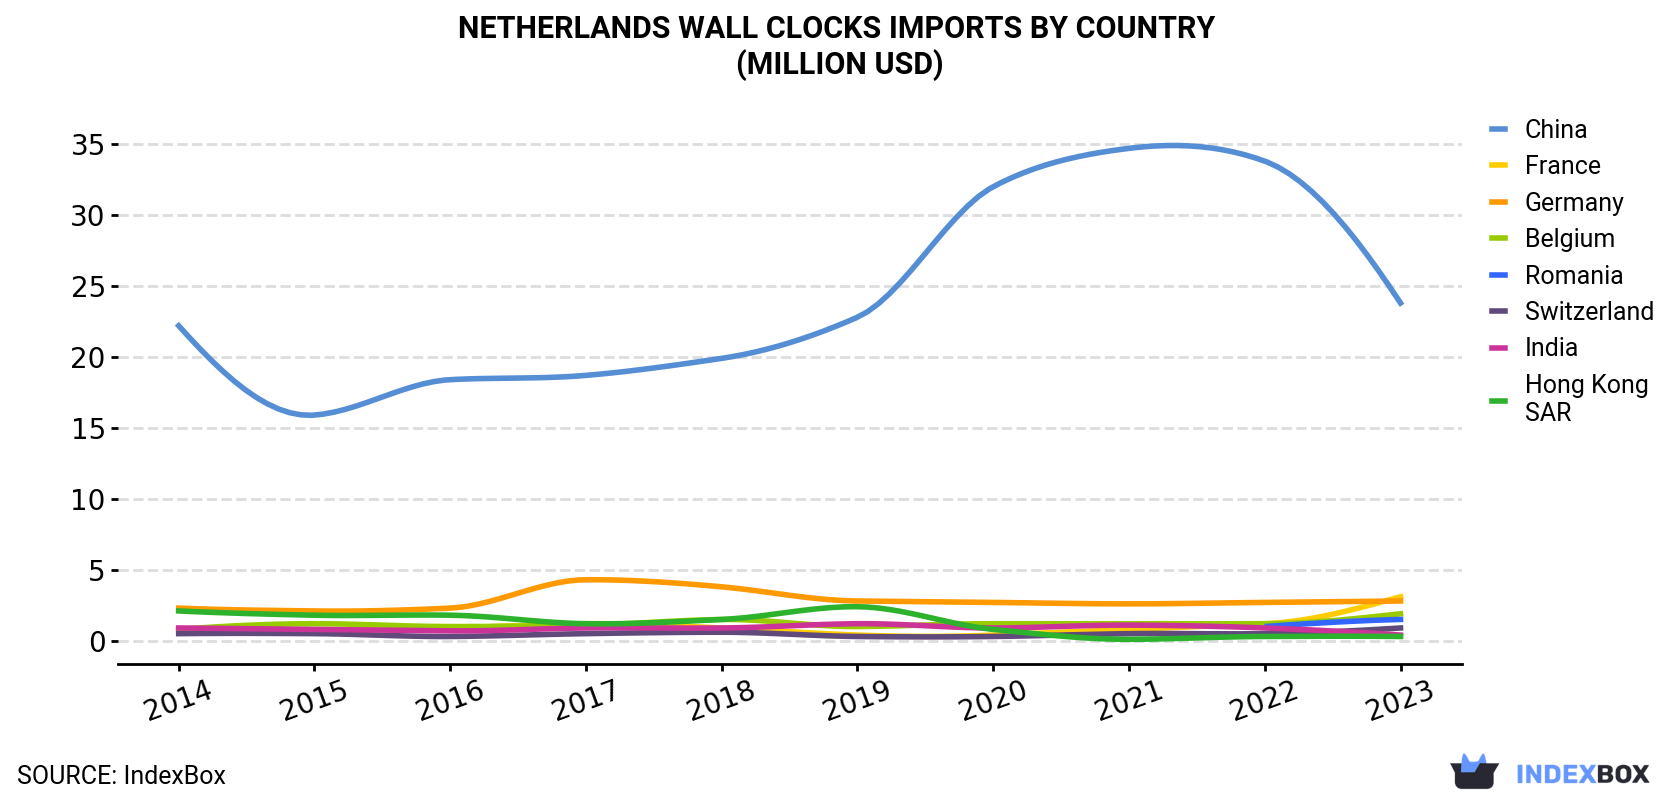
Imports by Country
In 2023, China (6.1M units) constituted the largest supplier of wall clocks to the Netherlands, with a 74% share of total imports. Moreover, wall clocks imports from China exceeded the figures recorded by the second-largest supplier, France (699K units), ninefold. Germany (426K units) ranked third in terms of total imports with a 5.2% share.
From 2014 to 2023, the average annual rate of growth in terms of volume from China was relatively modest. The remaining supplying countries recorded the following average annual rates of imports growth: France (+27.3% per year) and Germany (+3.6% per year).
In value terms, China ($24M) constituted the largest supplier of wall clocks to the Netherlands, comprising 64% of total imports. The second position in the ranking was taken by France ($3.1M), with an 8.5% share of total imports. It was followed by Germany, with a 7.5% share.
From 2014 to 2023, the average annual rate of growth in terms of value from China was relatively modest. The remaining supplying countries recorded the following average annual rates of imports growth: France (+16.5% per year) and Germany (+2.3% per year).
Imports by Type
In 2024, clocks, other than watches, wall clocks and instrument panel clocks (8.3M units) constituted the largest type of wall clocks supplied to the Netherlands, with a 89% share of total imports. Moreover, clocks, other than watches, wall clocks and instrument panel clocks exceeded the figures recorded for the second-largest type, clocks; with watch movements, excluding clocks of heading no. 9104 (1M units), eightfold.
From 2014 to 2024, the average annual rate of growth in terms of the volume of clocks, other than watches, wall clocks and instrument panel clocks imports was relatively modest.
In value terms, clocks, other than watches, wall clocks and instrument panel clocks ($36M) constituted the largest type of wall clocks supplied to the Netherlands, comprising 95% of total imports. The second position in the ranking was held by clocks; with watch movements, excluding clocks of heading no. 9104 ($1.8M), with a 4.8% share of total imports.
Import Prices by Country
In 2023, the wall clocks price stood at $4.5 per unit (CIF, Netherlands), falling by -10.8% against the previous year. Overall, import price indicated slight growth from 2014 to 2023: its price increased at an average annual rate of +1.3% over the last nine years. The trend pattern, however, indicated some noticeable fluctuations being recorded throughout the analyzed period. Based on 2023 figures, wall clocks import price decreased by -26.5% against 2021 indices. The growth pace was the most rapid in 2020 when the average import price increased by 27%. The import price peaked at $6.1 per unit in 2021; however, from 2022 to 2023, import prices remained at a lower figure.
Prices varied noticeably by country of origin: amid the top importers, the country with the highest price was Hong Kong ($7.1 per unit), while the price for China ($3.9 per unit) was amongst the lowest.
From 2014 to 2023, the most notable rate of growth in terms of prices was attained by Belgium (+16.6%), while the prices for the other major suppliers experienced more modest paces of growth.