Graphic by me, data from US Census 2023 data. I used the census reporter page for each individual metro area, and have shown the top 25 largest by population.
Posted by TA-MajestyPalm
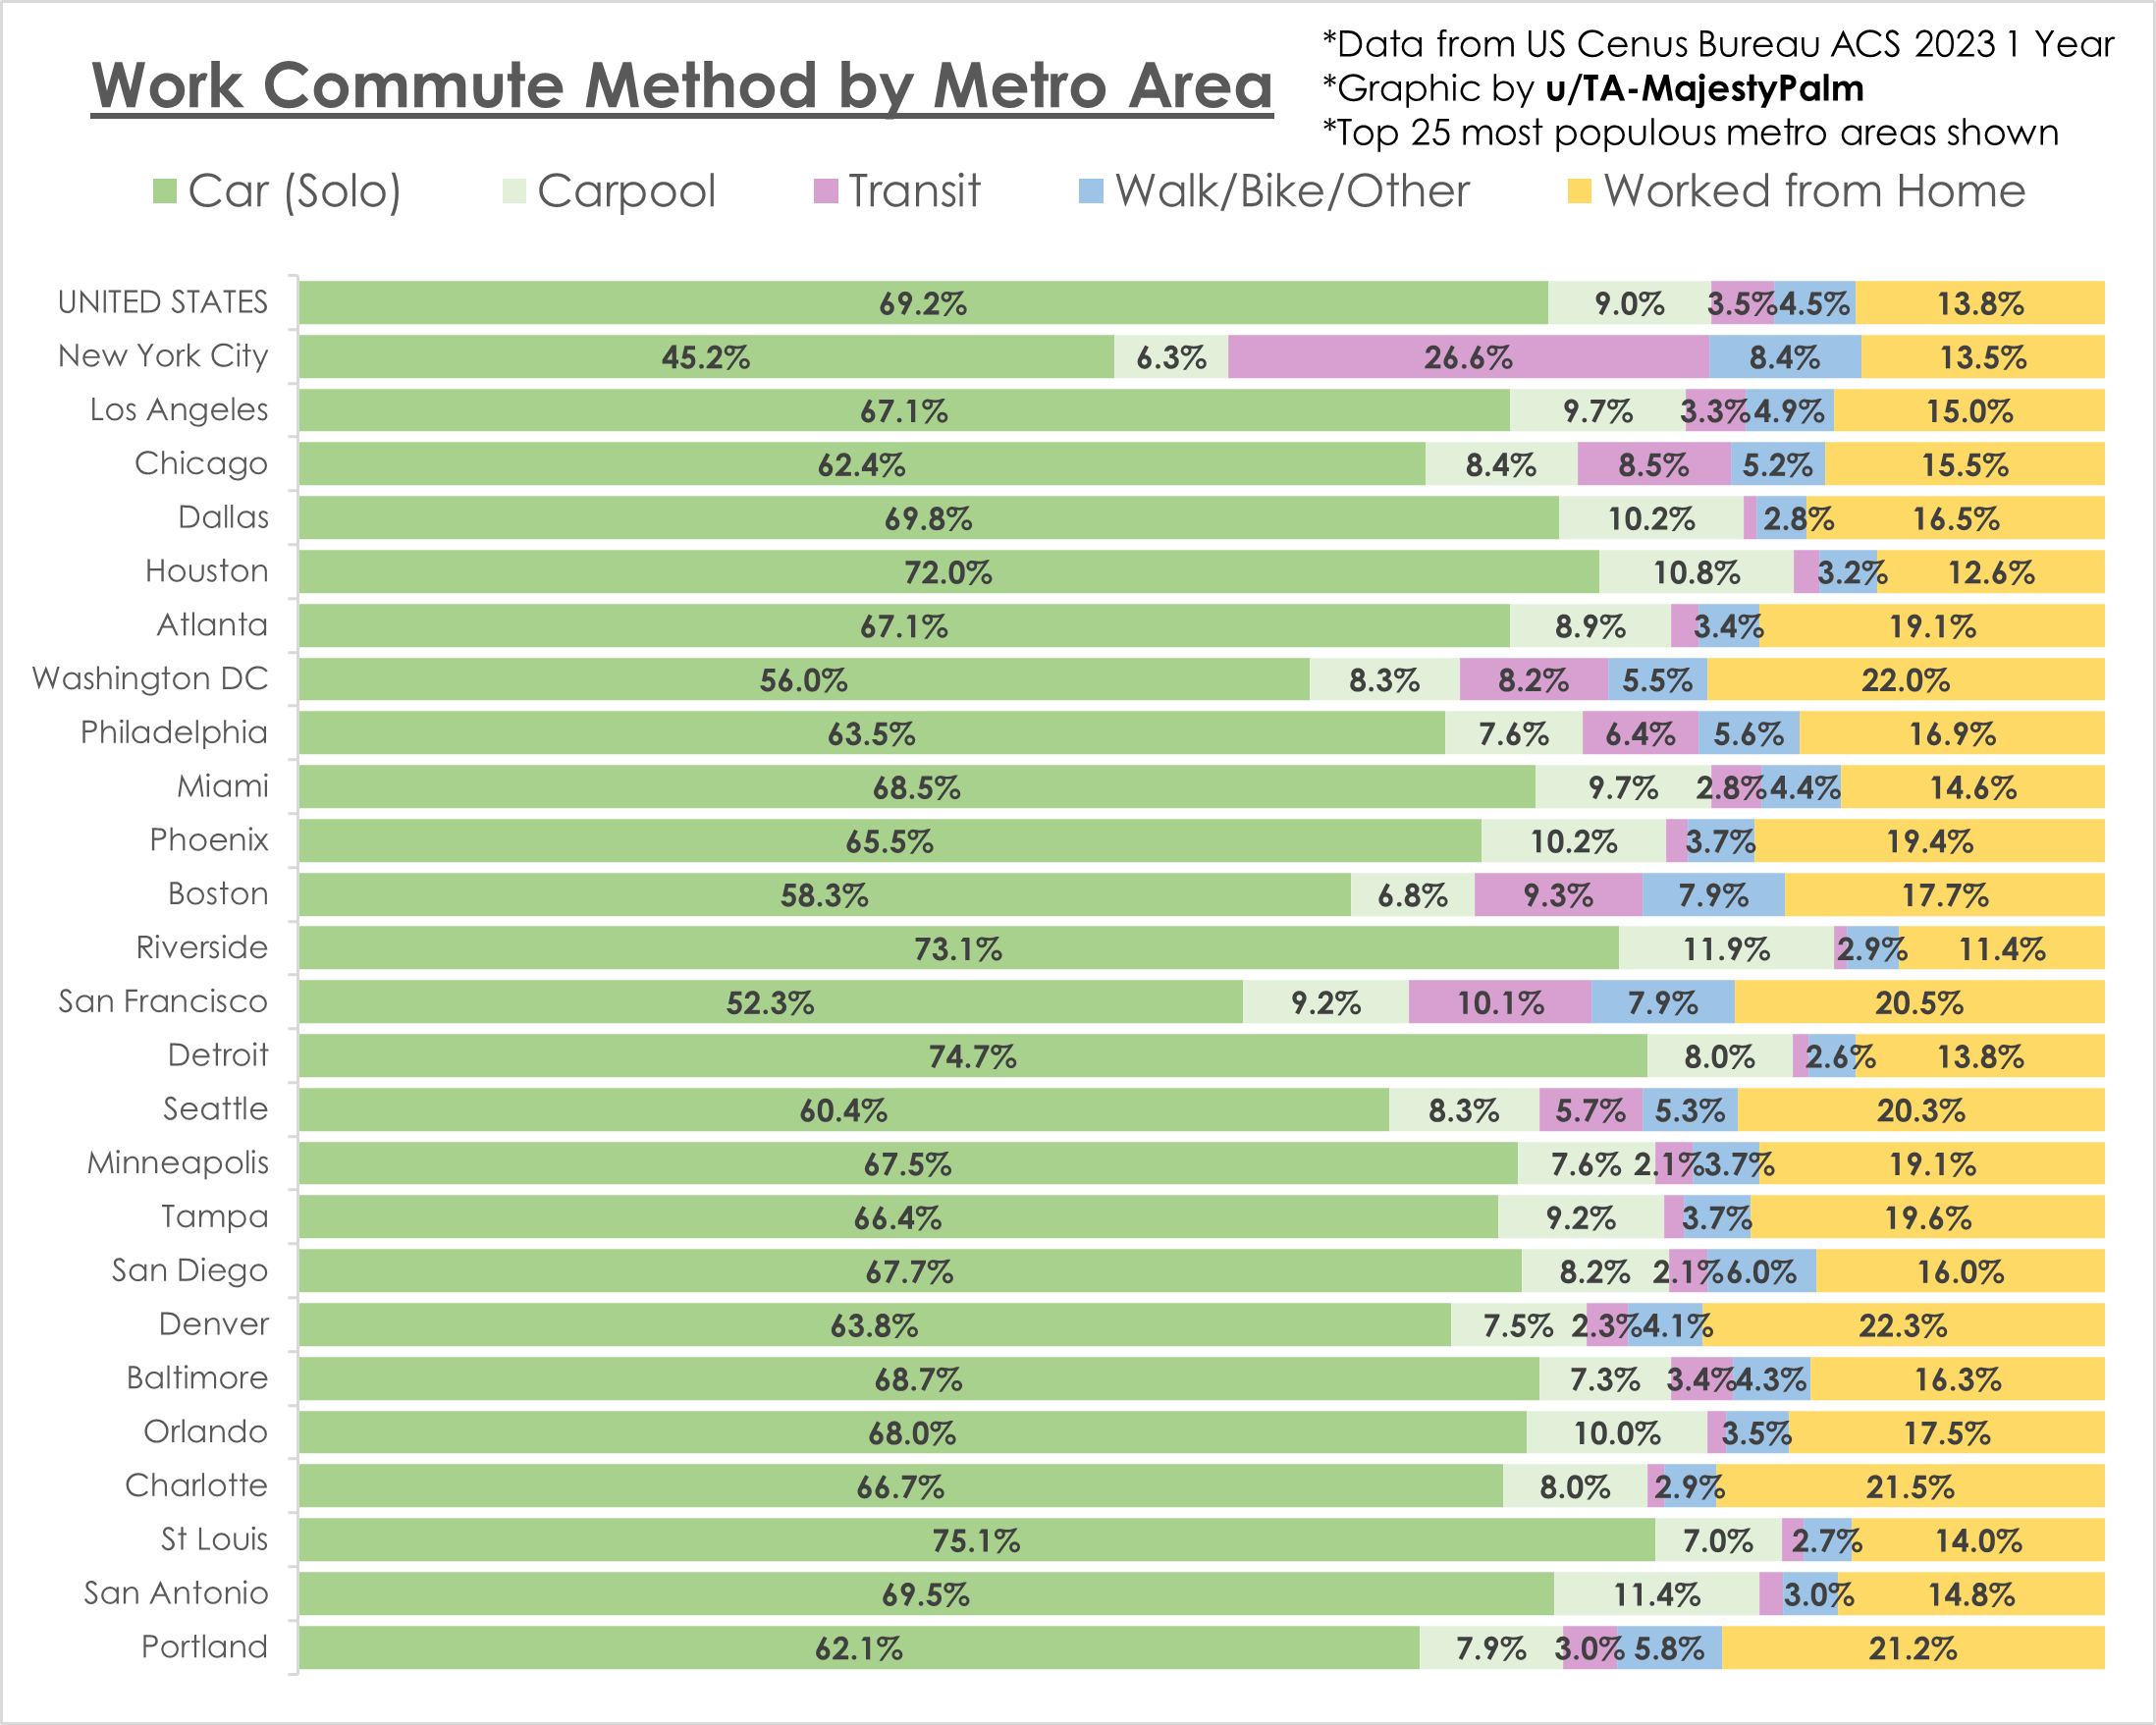
![[OC] US Work Commute Method by Metro Area](https://www.europesays.com/wp-content/uploads/2025/03/6qmykp0qjfpe1-1920x1024.png)
Graphic by me, data from US Census 2023 data. I used the census reporter page for each individual metro area, and have shown the top 25 largest by population.
Posted by TA-MajestyPalm
20 comments
Graphic by me, data from US Census 2023 data. I used the census reporter page for each individual metro area, and have shown the top 25 largest by population.
[Example source link (NYC Metro Area)](http://Graphic by me, data from US Census 2023 data. I used the census reporter page for each individual metro area, and have shown the top 25 largest by population.)
Does this mean that 22% of people in DC work from home?
Because that doesn’t make sense. I mean, if you have a WFH job, why would you live in DC?
i have doubts that carpooling is twice as popular than transit…even if a spouse is dropping another off.
Surprised Portland is so low. They have a great light rail and a big cycling culture.
This is sad if it’s accurate.
Would be interesting to see the contrast with other parts of the world, US is quite car-centric as can clearly be seen.
I’d be interested to see this compared to other cities around the world
This is striking. I wonder how Europe would look…
I am curios where Nashville stands.
From a Europeans pov this is unbelievable, I live in Barcelona and 90% of my colleagues come by metro/train to work, maybe more.
I live in a metro area with what is considered a good public transit system and am not at all surprised by these numbers, if this is transit for the whole metro area and not just into the hub. If you don’t live near a spoke and are also going downtown, public transit is abysmal. I live a mile from a bus stop and half a mile on the other end with no direct route. 20 min drive, 2hr public transit, 2.5.hr just walking the whole way.
Miami-Dade county just rescinded all work from home. Our numbers are about to change significantly.
Used to live in the Riverside MSA and not surprised it’s one of the highest for the car method. Other forms of transport are basically non-existent.
Minneapolis: Blue, but Midwestern Blue (we still use cars)
very pretty graphic! Would also be interesting for international comparison
69.2%?
Lets shoot for >80% you damn hippies!
The stats only tell part of the story. In many of these areas, commutes are car centric for the simple reason that transit is simply not available nor practical. It’s sad.
can you add a distance/time chart?
Yet they viciously attacked working from home as if everyone was working from home
I would be curious to see what this looks like if you only counted those who actually commute, but that’s an extra step I’m not up for at the moment.
I was curious what things would look like if you group transit with walk/bike/other. That’s a generally-fine proxy for transit-oriented cities.
1. New York – 35%
2. San Francisco – 18%
3. Boston – 17.2%
4. Washington – 13.7%
5. Chicago – 13.7%
6. Philadelphia – 12%
7. Seattle – 11%
8. Portland – 8.2%
9. Los Angeles – 8.2%
10. Baltimore – 7.7%
If you include WFH, Washington passes Boston and Seattle and Portland pass Chicago and Philly. Denver and Charlotte end up at 9 and 10 respectively.
Comments are closed.