Figure 2 illustrates the Pareto-approximate adaptation pathways and their corresponding objective values discovered through multi-objective optimization. The solution set comprises 630 policies, each representing a distinct configuration of adaptation strategies tailored to different neighborhoods. The pathways are optimized to address five key objectives: reducing the overall cost, minimizing heat-related mortality, lowering CO2 emissions, improving reliability by decreasing the worst-case mortality year, and reducing inequality by reducing the maximum mortality rate difference between neighborhoods, a set of objectives that encompass conventional health goals, that recognize economic constraints on adaptation investments, and that address concerns related to greenhouse gas mitigation, disaster reduction, and vulnerability distributions prioritized in the City’s Climate Action Plan, Disaster Preparedness and Planning Project, and Sustainability Plan, respectively34,35,39. Over the 50 years of the simulation period and averaged over all SOWs, the pathways cost between 18 million and 1.023 billion dollars; and reduce heat related mortality by 81–670 deaths, considering different investment plans in the city’s neighborhoods.
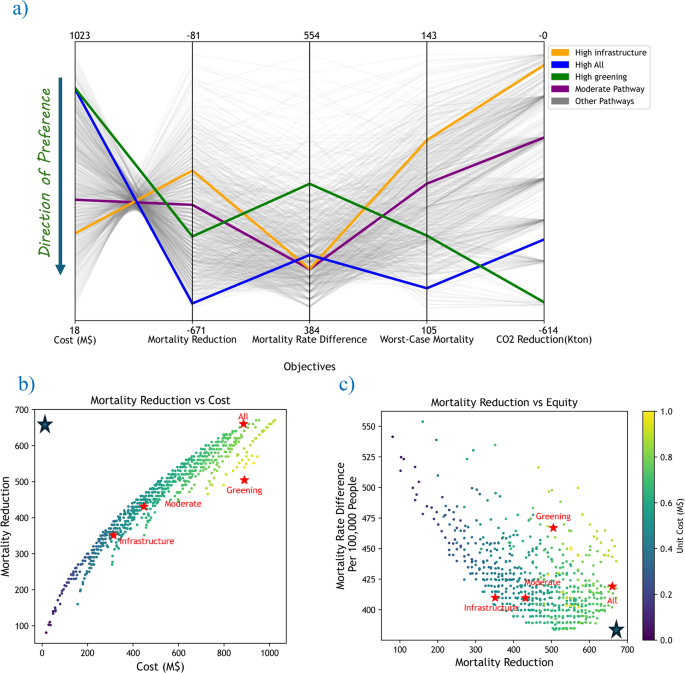
(a) Parallel coordinate plot of different objectives, showing all Pareto optimal solutions (gray) and pathways representative of different cooling strategies (colors). (b, c) Tradeoff between pairs of objectives of the generated adaptive pathways: total cost and mortality reduction in (b) and mortality reduction and equity (difference in heat-related deaths between CSAs) in (c).
Four pathways are color-coded in Fig. 2(a) to highlight solutions with different combinations of strategies. Specifically, we examine four contrasting representative pathways: high investment in multiple strategies (blue; “all strategies”), moderate investment in multiple strategies (purple), focus on tree planting (green; “greening focused”), and focus on cool roofs and pavements (orange; “infrastructure focused”). These are only four of many Pareto-approximate solutions. We focus on them as representatives of different ways in which the city could approach heat mitigation. These representative pathways were defined based on specific distinguishing metrics (see Methods). We present results for one example of each type of pathway and find that results are similar for all Pareto-approximate solutions that share those characteristics (Supplementary Fig. 1). In this figure, each y-axis measures performance with respect to one of the five optimization objectives, with movement down the axis indicative of better performance—a “perfect” solution would yield a flat line along the x-axis. The slope of the lines between axes, then, reveals the degree of tradeoff between objectives: a steeper slope suggests a more significant tradeoff between two competing goals.
Focusing on the highlighted example pathways, we see that in this formulation of the model, a greening-focused pathway that invests heavily in tree planting can achieve substantial reductions in total heat-related mortality and CO2 emissions, compared to not using any adaptation, but that it fails to perform well in terms of reducing inequality in heat-related mortality. This outcome indicates that while the indicative tree planting pathway we have highlighted is effective for environmental and health benefits, it does not equally distribute these benefits across neighborhoods, leading to disparities. In contrast, the pathways representative of a more balanced or infrastructure-focused approach, which emphasize cool pavements and cool roofs, exhibit superior performance in reducing the mortality rate difference between neighborhoods, thereby better meeting the equality criterion, and doing so at lower total cost. Their performance on carbon sequestration is not as good as the tree-focused pathway, and they do not reduce total mortality as much as the tree planting pathway or the “all strategies” option (blue).
Figures 2(b) and 2(c) further illustrate the tradeoffs between pairs of objectives for all solutions, as well as the representative pathways. Overall, as more is spent on a heat mitigation pathway, more lives are saved (Fig. 2(b)), and the unit cost of saving a life increases (colors in Fig. 2(b) and 2(c)); i.e., the marginal benefits for mortality reduction diminish with increasing investment. There is a tendency for higher unit cost, more expensive and mortality-reducing pathways to reduce disparities between neighborhoods—the general negative association in Fig. 2(c)—but there is considerable scatter, with different strategies yielding different inequality outcomes at a common level of mortality reduction. In fact, the most expensive and mortality-reducing pathways do not yield the smallest differences in mortality between neighborhoods (the slight upward tendency at high mortality reduction values in Fig. 2(c)). Interestingly, for a given level of mortality reduction, it is not necessarily true that the more expensive pathways most effectively reduce mortality disparities. At each mortality reduction level, lower-cost pathways frequently outperform higher-cost pathways with respect to the mortality difference between neighborhoods; i.e., they result in reduced inequality in outcomes.
Why doesn’t higher spending consistently reduce inequality? And, specifically, why is it that pathways focused on tree planting perform relatively poorly with respect to inequality? This is initially surprising, given the emphasis placed on urban greening to address the urban heat island in so many cities. The proximal reason is that the tree-dominated strategy invests less in underserved neighborhoods (Fig. 3). Where infrastructure focused (cool roofs and pavements) and moderate balanced strategies weight investment towards inner city neighborhoods and the poorer neighborhoods towards the northwest of the city, the “all strategies” and greening dominated pathways have different geographic distributions. Even though reduced inequality is one of the optimization criteria, these expensive paths do not aggressively favor spatial patterns that would achieve it.
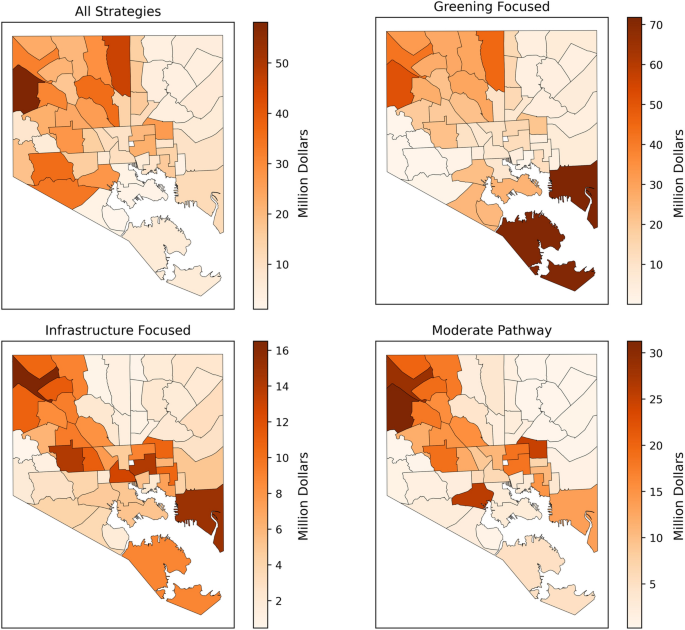
Map of total investment (Million $) per community statistical area (CSA) for representative pathways focused on all strategies, greening, infrastructure and moderate development of each strategy. The maps were generated using the matplotlib python package version 3.7.169,70, https://doi.ieeecomputersociety.org/10.1109/MCSE.2007.55.
One contributing explanation for this is the lack of tree planting sites in the urban core (Supplementary Fig. 2). This implementation of City-HEAT calculates the number of planting sites in each CSA using the USGS Chesapeake land cover maps40. The landcover map indicates that it is not possible to plant large numbers of trees in the hot and vulnerable neighborhoods that might need them most. Is this true? Not in a literal sense, but to some extent it is accurate, since it is considerably more expensive and riskier to create a space for a tree by removing concrete, rehabilitating tree pits, or demolishing vacant buildings than it is to plant a tree in an open space. Indeed, one of the community concerns about current government-supported tree initiatives in Maryland is that contracts are awarded on a cost-per-tree basis, which encourages planting in easily greened areas that tend to be more affluent. But it is not strictly true that there are not enough places to plant trees in urbanized, low-income neighborhoods. It simply requires more investment. In this respect, the model’s adherence to the stated availability of tree planting sites forces ambitious greening pathways to favor less urban, lower impervious surface neighborhoods, when a committed approach to greening underserved communities might, in fact, be favorable, even if it comes at higher cost. It should also be noted that our distributional results focus on only one way in which one might define a fair, equal, or equitable outcome; evaluating strategies on the basis of distributional outcomes, as is done in City-HEAT, doesn’t capture all aspects of equity and can miss context-specific nuances relevant to local outcomes41.
But lack of planting sites alone does not explain the result: in simulations that apply uniform planting site availability to the entire city, we still see tree-dominated pathways perform relatively well on mortality reduction but poorly on distributional outcomes. A complementary reason is the way in which heat vulnerability is defined in the model. The neighborhoods with relatively low impervious surface and high percentage of easily plantable land covers also tend to be demographically older. Age is a significant risk factor for acute heat-related mortality. City-HEAT considers both age and income when calculating mortality risk, so neighborhoods that are relatively well-off but also relatively older are, for the optimization algorithm, good targets for mortality reduction, even if the baseline heat-related mortality rate is relatively low.
These findings highlight the complexity of urban heat adaptation planning. It is important to consider multiple, often competing, objectives and to interrogate assumptions and constraints. For instance, while tree planting initiatives are valuable for environmental sustainability and public health, they do not ensure optimal distribution of benefits across all neighborhoods; for the distributional outcomes metric used in City-HEAT, for example, tree-oriented pathways performed poorly even as they performed well for other objectives. Such strategies might need to be placed in a diverse package of adaptation techniques that include infrastructure solutions that are more easily applied in a dense urban matrix, or they might need to emphasize relatively expensive planting strategies that yield healthy trees in difficult urban environments. This multifaceted approach is essential for developing robust adaptation policies that not only mitigate the impacts of urban heat but also promote inclusive benefits.
To further illustrate the four representative pathways, Fig. 4 shows the performance of each pathway through time, averaged for all SOWs. In analyzing the performance of our four distinct heat adaptation pathways, our results highlight significant improvements across all strategies in reducing heatwave days (HWD) and heat-related mortality. Benefits for both are greatest in the “all measures” pathway, which offers about a 25% improvement relative to the lower cost “infrastructure” pathway by the end of the simulation period. However, both the ‘all measures’ pathway, integrating a high concentration of cooling techniques, and the ‘greening’ pathway, which emphasizes planting trees, require substantial upfront investments. These investments result in a steeper financial trajectory over time, suggesting the need for significant initial funding but promising potentially greater long-term benefits in reducing urban heat and enhancing environmental health. Such comprehensive strategies, while effective, pose challenges in scalability and immediate cost burden, which might limit their applicability in financially constrained urban settings.
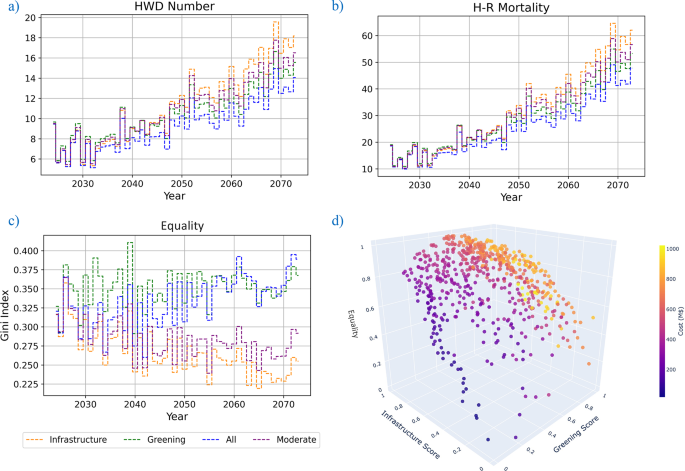
Change in the number of heatwave days (a), heat related mortality (b), equality (Gini index method) (c) throughout the simulation period for the four representative pathways. The values are averaged across all training SOWs. (d) shows the relationship between developing greening or infrastructure with equality. The values are standardized for all three metrics, with 1 showing the highest and 0 showing the lowest.
The implications of these pathways for distributional outcomes are shown in Fig. 4 by applying a Gini index calculation to heat-related deaths across CSAs. The Gini index is a measure of statistical dispersion that represents the inequality in a distribution, commonly used to quantify income or wealth disparities. In this context, it quantifies inequality in heat-related deaths. A Gini index of 0 indicates perfect equality, while a Gini index of 1 indicates maximum inequality42. Throughout the simulation period the 4 representative pathways result in Gini index of between 0.2 and 0.4 on average. Pathways that reduce inequality in heat-related mortality in a highly economically stratified city like Baltimore are considered to be distributionally effective, in that they are defined by investments that reduce the disparity between vulnerable and less-vulnerable neighborhoods.
Consistent with the results shown in Fig. 2, there is a divergence in Gini index between the representative pathways. The paucity of available tree planting sites in marginalized neighborhoods and the prevalence of older adults in some of the more affluent neighborhoods with abundant planting spaces leads the model to generate greening pathways that direct investment towards less urbanized parts of the city, thus not benefiting all city residents equally and possibly exacerbating socio-economic disparities. The “all measures” approach tends in the same direction largely because those pathways also include large amounts of tree planting. For both of these pathways, investment in non-tree strategies is distributed to neighborhoods with relatively high socio-economic vulnerability; it is the tree investments that drive the balance of investment towards less economically vulnerable neighborhoods (Supplementary Fig. 3). In contrast, the moderate pathway distributes its benefits more uniformly, since tree planting does not dominate the approach, and marginalized neighborhoods have ample sites available for white roofs and cool pavements relative to wealthier neighborhoods. This indicative pattern is also clear when we look at the relationships between infrastructure, greening, and distributional outcomes across all Pareto-approximate solutions (Fig. 4d). As spending on infrastructure (cool roofs and pavements) increases, the equality score rises. But as spending on green infrastructure rises there is no systematic reduction in inequality.
These results highlight several considerations in heat mitigation planning: (1) the use of mitigation strategies that are most easily implemented in vulnerable neighborhoods can lead to pathways that reduce distributional inequality at relatively low cost; (2) assumptions about what kinds of mitigation actions are possible—e.g., tree planting in soil vs. in areas that are currently paved—will have a major influence on estimated benefits and distributional implications of different cooling strategies; (3) the most expensive pathways tend to save the most lives, but they do not necessarily minimize inequalities in heat burden.
Distributional outcomes in neighborhood investment
Baltimore, like many cities, is strongly rooted in its neighborhoods. As a highly segregated and economically divided city, Baltimore is also a place where disparity is very much perceived and discussed at neighborhood scale. A global metric such as the mortality rate difference or Gini index, may be indicative of a form of distributional effects, but if a proposed adaptation pathway fails to invest and improve conditions in historically marginalized neighborhoods then it will not be viewed as acceptable in the terms most frequently discussed in the City and embodied in City plans like the 2019 Sustainability Plan, which defined sustainability through a lens of racial equity34.
To understand the distributional outcomes of representative pathways in these terms, we examine heatwave outcomes and investment patterns across the 55 CSAs of Baltimore. Each CSA is an aggregation of neighborhoods, as colloquially defined (there are over 200 commonly used neighborhood designations in Baltimore City), but the CSAs capture the pattern of economic and social conditions across the City. When the CSAs are ranked by median household income, we see that investments over time in the representative greening-oriented pathway (Fig. 5a) show no particular pattern with respect to the economic status of the CSA. The poorest neighborhoods receive relatively little investment, while very large investments are made in some middle- and high-income CSAs. Averaged over all SOWs, the yearly investment in each CSA peaks at 3 million dollars for the greening pathway and at 0.8 million dollars for the infrastructure pathway.
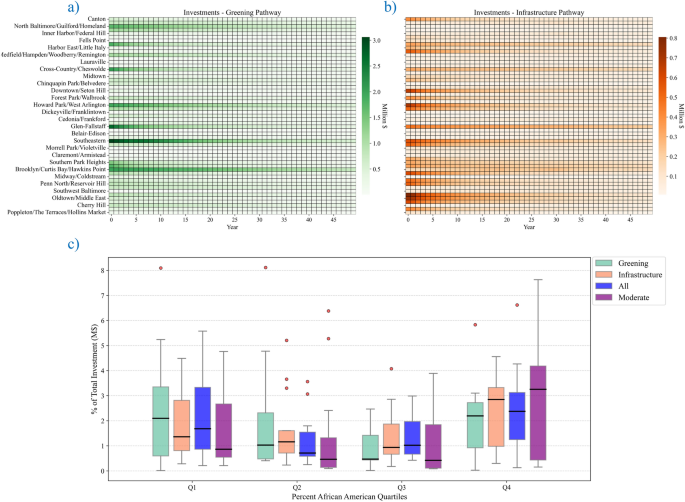
Investment patterns across CSAs, ordered bottom to top by median household income, for greening pathway (a), Infrastructure pathway (b) through time and for four representative pathways for quartiles of percent African-American residents (c).
In the infrastructure-oriented pathway, there is a stronger tendency to weight investment to some of the poorest CSAs (Fig. 5b). There is still considerable scatter in investments across the economic gradient, as these pathways are shaped by multiple objectives and constraints, and they do not explicitly optimize for progressive investment patterns. Community perspectives emphasize the importance of aligning such pathways with the distribution of health outcomes, particularly in neighborhoods with the highest heat burden43.
Viewed in terms of distributional effects by race, all four representative pathways invest most heavily in the top quartile of percent African-American CSAs (Fig. 5c), a consideration that is not represented in the model but that is a City priority and something that correlates with mortality differences between neighborhoods. Baltimore’s historical patterns of disinvestment and redlining continue to influence contemporary inequalities in urban heat vulnerability, underscoring the need for more targeted and intentional investments41. But the infrastructure-oriented and moderate pathways, which scored well in the aggregate mortality-based distributional outcomes objective (Fig. 2), direct a much higher percentage of total investment to those CSAs, in contrast to the greening-oriented and all measures pathways, which spread spending more evenly across CSAs. Race is not directly considered in City-HEAT, but pathways that perform better on the model’s defined mortality-based equality metric also tend to invest more heavily in African-American neighborhoods, reflecting the health burden patterns that motivated the City to frame its Sustainability Plan in terms of racial equity.
Sensitivity to climate trajectory
City-HEAT optimizes its decision rules over all SOWs it is provided. For the analyses presented so far, we trained the model using the full range of future climate trajectories included in our family of climate scenarios (see Methods section). Since City-HEAT pathways are dynamic adaptive policy pathways (DAPP), decision rules trained using all future climate scenarios should be able to produce high performing pathways even for very different climate trajectories: the same decision rules should succeed for both high and low warming rates.
It is not obvious that this dynamic characteristic will also apply when the model is trained with one set of climate scenarios (e.g., low warming rates) and then applied to other climate realizations (e.g., unexpectedly high warming rates). This is of interest, since planning for low warming rates may result in adaptation measures that are inadequate, should warming turn out to be higher than expected, but planning for high warming rates might incur unnecessary costs if warming turns out to be more gradual. From the perspective of policy formulation, actors inclined towards risk-averse planning that focuses on high-end warming events might be at odds with actors who view climate change as a low concern and prefer to plan for low warming estimates. To examine the influence of climate expectation, we optimized City-HEAT using only high warming scenarios and again using only low warming scenarios. Then we examined distributional outcomes and robustness scores when strategies optimized for one anticipated warming rate were confronted with out-of-sample realizations from the warming rate they optimized for (e.g., high warming training, high warming scenarios) or with the opposite (e.g., high warming training, low warming scenarios).
To quantify robustness in this analysis, we use the satisficing method38,44. Satisficing is used in decision-making theory to describe a strategy that aims for acceptable results rather than optimizing a specific criterion. In this context, we assess the robustness of various solutions based on two primary criteria: the Gini index as an indication of distributional outcomes in heat-related mortality and a Reliability index as an indication for worst case heat-related mortality numbers. These metrics help us understand the distributional outcomes and consistency of outcomes across different SOWs. To ensure the rigor of our robustness analysis, we employed out-of-sample SOWs to evaluate the performance of the proposed adaptation pathways. This approach allowed us to test the strategies under conditions not previously considered in the initial modeling phase, thereby assessing their generalizability. Details of this analysis are provided in the Methods section.
Our climate crossover analysis yields several notable results (Fig. 6). First, the costs of optimal pathways do not differ dramatically between the four considered training and application SOWs. Here, costs of investments have been determined as the sum of discounted costs of implementation and maintenance for all mitigation strategies throughout the 50 year simulation period, averaged across scenarios. Total costs rise to a somewhat higher maximum for solutions trained on high warming rates—the slightly brighter pink dots in the top right panel of Fig. 6, for example—but this is a small difference, and there is no systematic difference between the pathways produced using high warming or low warming training data in the unit cost of saving a life (the x-axis values; compare the values in top right to bottom left panels and top left to bottom right panels). For this implementation of City-HEAT, then, planning for the worst does not result in overspending relative to more optimistic approaches.
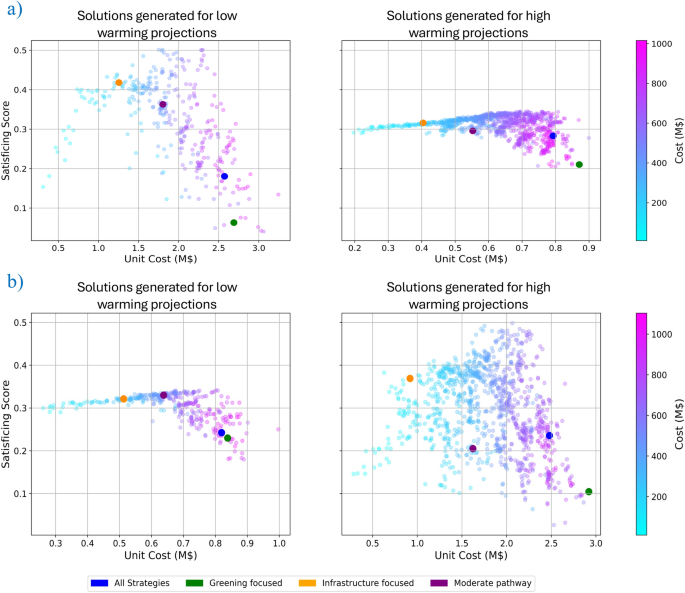
Satisficing scores for all solutions generated for low warming and high warming projections. The scores are calculated for out of sample projections drawn from (a) consistent scenarios (low warming for low warming and high warming for high warming) and (b) cross examination of scenarios (low warming for high warming and high warming for low warming).
A second notable result is that the pathways trained on low warming projections produce robustness scores under high warming rates (bottom left panel, Fig. 6) that are comparable to the scores of pathways trained with high warming rates and confronted with high warming rates (top right panel). There is no evidence that failing to train pathways for high warming leads to markedly poorer performance in terms of those objectives if high warming rates are encountered.
Taken together, the relative similarity of cost and performance for the two differently trained sets of pathways suggests that the climate projection—and uncertainty in that climate projection—does not have a major impact on the selection of optimal adaptation strategies. This is in part due to the constraints on the solution space (spending restrictions, available sites for interventions, multiple competing objectives) and in part due to the fact that a trained “pathway” is a set of decision rules rather than a fixed set of investments. The investment pattern for any given pathway emerges over time and is responsive to realized conditions—e.g., more spending on interventions as impacts of heat grow. Insomuch as a local government can adopt such a decision rule approach, as opposed to a fixed long-term heat mitigation spending plan, there is significant opportunity for “no regrets” adaptation investments, and perhaps for agreement on decision rules across groups with different views on the risk of future climate change.
That said, the unit cost of saving a life is much higher for low warming trajectories (top left panel and bottom right panel), regardless of how the pathways were trained. This is a logical result of the fact that fewer lives are at risk, and thus fewer lives are saved, if warming occurs at a low rate. In this sense, there is the potential for regret. While the total cost of a heat mitigation portfolio is lower for the lower warming rate, decision-makers might regret expenditures on mitigation if it turns out that the amount and impacts of warming are smaller than feared, so that the investments result in saving a relatively small number of lives.
When looking at the representative pathways, we see no systematic changes in pathway behavior for the various warming training and realization tests. The “greening-focused” and “all strategies” pathways tend to be more expensive and satisfice less when compared to the infrastructure-focused and moderate pathways. At higher warming rates the gap in satisficing does close, but it does not disappear. There is some variability in the details of representative pathways performance for the different tests shown in Fig. 6. But this variability is to be expected, since these are representative pathways that are not identical realizations for all four tests. These results are in accordance with previous studies applying DPS in similar settings; as by applying DPS to find adaptive pathways, the models could perform well even while only trained using one SOW, when tested against other SOWs45,46.