We compiled a dataset of soil microbial CUE at cross-biome scale. Part of dataset was derived from Qiao et al., 2019, which included 780 observations in incubation experiments from 98 sites across the globe. It reported the metadata of coordinates (latitude and longitude) of soil samples, incubation temperature, incubation time, and the substrate added, but some information of sampling depth was lacked. As such, we added the information of sampling depth from original references37. We further added and updated this dataset of soil microbial CUE from peer-published references before 1st August 2022 using the Web of Science, Google Scholar, and the China National Knowledge Infrastructure. We used the following combinations of keywords for searches: (“soil microbial” OR “soil microbe”) AND (“carbon use efficiency” OR “CUE” OR “microbial carbon accumulation” OR “cumulative heterotrophic respiration” OR “carbon substrate consumption”). Soil microbial CUE was directly reported from references or any of microbial C accumulation, cumulative heterotrophic respiration, C substrate consumption in lab conditions were clearly described so that CUE could be estimated based on its definition37. When needed, the microbial CUE data were extracted directly from figures or using the GetData Graph Digitizer (version 2.0). This ultimately led to an expanded CUE with 1145 observations).
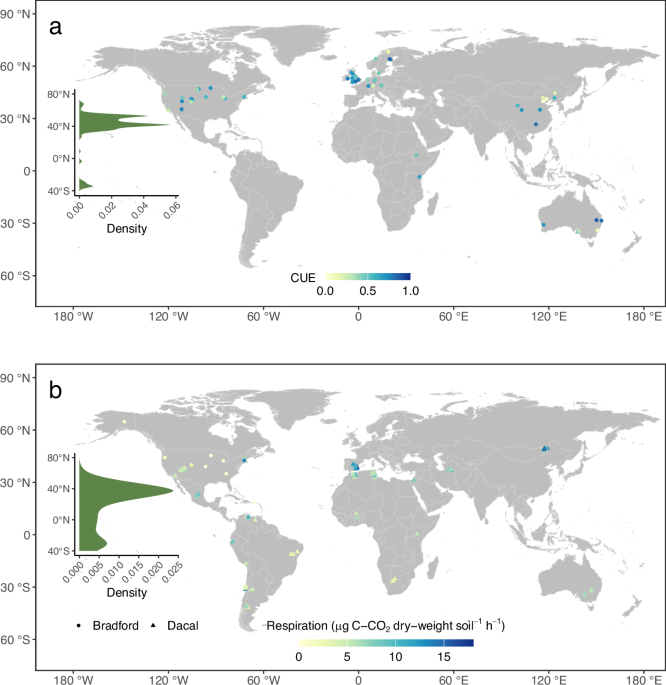
We used the following criteria to select the studies or CUE values that were used in our study: (1) no disturbance and contamination occurred during soil sampling (thus also excluding measurements on microbial isolates); (2) if the experiments included other treatments, such as warming, elevated CO2, nitrogen addition, or other experimental treatments, only data from the control were used; (3) soil microbial incubation temperature, the type of substrate added, and soil sampling depth had to be provided; and (4) for standardization purposes, we limited the data of soil microbial CUE experiments to surface samples (≈0-30 cm; no samples from the litter layer) and further excluded the observations of CUE with missing information of incubation temperature and/or the substrate added. This ultimately led to a total of 618 (with C-based substrate) (Fig. 1a) and 826 (Supplementary Fig. 5) (with C-based substrate and water-based substrate – 18O-H2O method26) samples of surface soil microbial CUE. Overall, the studies in the dataset were located between 71.9°S to 78.9°N, with MAT ranging from –5.6 °C to 27.4 °C and MAP from 32.1 mm to 3147 mm (Fig. 1a and Supplementary Data 1). Collectively, the meta-data of CUE were compiled from several studies (n = 68) in which various types of substrates were added. Following previous studies37,55, we classified them into 16 types (see Supplementary Data 1 for details).
We used two large-scale published datasets of soil heterotrophic respiration rates and both of these two datasets have been used to investigate the thermal adaptation of respiration. The first set of data was from Dacal et al.5, which sampled surface soils across 110 global dryland ecosystems located in 19 countries across all continents except Antarctica between June 2006 and December 2013. In each dryland site, five replicates of soil were randomly sampled in vegetated microsite and open microsite, respectively. Soil samples were then bulked and homogenized to derive two composite samples per site, thus leading to 220 soil samples in total. These 220 soil samples were incubated in three profiling assay temperatures (10, 20, 30 °C) to measure soil heterotrophic respiration rates with substrate in excess (glucose). This ultimately led to sample size of 660 used in both the study by Dacal et al.5 and in our study (Fig. 1b). The second set of data was from Bradford et al.6, which sampled surface soils in two vegetation types (forest vs herb) across 3 years (2010, 2011, 2012) from 11 locations (including 10 US Long Term Ecological Research [LTER] stations) ranging from Hawaii to Northern Alaska in North America. The soil samples were incubated in profiling assays to measure soil heterotrophic respiration rates with controlled temperature (12, 20, 28 °C) and substrates in excess (glucose, oxalic acid, glycine). This ultimately led to sample size of 591 (after excluding three outlier values of respiration) for the study led by Bradford et al.5 and in our study (Fig. 1b). More details of soil samplings and measures of soil heterotrophic respiration in incubation conditions were presented in Dacal et al5 and Bradford et al.6. Different experimental designs, methods of measuring soil heterotrophic respiration and microbial biomass (which needed to be included in statistical analysis to estimate mass specific respiration)6,7 precluded the capability of merging these two independent datasets into a harmonized global dataset of soil heterotrophic respiration. Moreover, the lack of full reports on matched/paired measures of soil microbial growth, soil heterotrophic respiration and CUE also precluded the possibility of merging the three independent datasets of CUE and soil heterotrophic respiration.
Drivers of CUE
Incubation temperatures, substrates, and other environmental conditions such as mean annual temperature (MAT), aridity index, soil organic carbon (SOC) and soil C:N ratio as well as microbial composition (F:B ratio) were expected to influence CUE. As clarified above, incubation temperatures and substrate types were compiled from the literature. Since the majority of sites were lacking field measurements of environmental variables, we extracted the other environmental variables from global gridded rasters17 based on georeferenced CUE data. This approach provided standardized environmental variables across geographical areas, and avoided the inconsistence of data sources (field vs. rasters) with different spatial scales. As such, F:B ratio was derived from the recently published global maps17 based on the georeferenced coordinates of CUE. Climate variables – MAT and aridity index and soil properties – SOC and soil C:N ratio were derived from world climate and SoilGrids56, respectively, based on the georeferenced coordinates of CUE. Mean annual soil temperature (MAT_soil) was derived from the recently published global map of soil temperature based on the georeferenced coordinates of CUE36.
Statistical analysisCUE in incubation conditions
We first investigated the relationship between fungal:bacterial ratio and incubation temperature and CUE under laboratory conditions4,43. Generalized linear mixed models using Markov Chain Monte Carlo (MCMCglmm) were used to examine the dependence of soil microbial CUE on fungal: bacterial ratio, by controlling for the effects of incubation temperature and the substrate. We thus have
$${{CUE}}_{{incubation}}={{{\beta }}}_{1}F:B+{{{\beta }}}_{2}{T}_{{incubation}}+b+{{{\rm{\varepsilon }}}}$$
(1)
where \(F:B\) is fungal:bacterial ratio, \({T}_{{incubation}}\) is the incubation temperature, \({\beta }\) is the standardized fixed effect associated with an individual model parameter, \(b\) represents the random effect of the substrate, and \({\varepsilon }\) is random error which is assumed to follow a normal distribution with mean zero and standard deviation σ.
Effects of substrate and environmental conditions on CUE using original CUE
We assess whether CUE variations could be linked with natural environmental conditions after controlling for the effects of substrates and incubation temperature under lab conditions. A similar approach was previously used to examine the thermal adaptation of soil heterotrophic respiration when using a common or single substrate in lab incubation conditions6. To this end, while examining the relationships between original CUE and natural environmental conditions, we first used simple ordinary least squares linear regressions. Moreover, a random forest machine learning algorithm using randomForest package was applied to determine the importance of different variables including substrate, incubation temperature (\({T}_{{incubation}}\)), MAT, F:B ratio, aridity index, SOC and soil C:N57 on original CUE. Substrate types and incubation temperature were included as categorical and continuous variables, respectively, to control their effects on original CUE. As such, we have
$${CUE}=f({substrate},\,{T}_{{incubation}},{MAT},\,F:B{ratio},{aridity\; index},{SOC},{soilC}:N)$$
(2)
where CUE refers to ‘original CUE’ as opposed to the ‘detrended CUE’ presented below. Mean decrease in accuracy (%IncMSE) was calculated to identify the more important variables as those with greater values of %IncMSE. The significance of variables was evaluated using rfPermute package. Moreover, partial functions of the most important variables (MAT and F:B ratio) were plotted using pdp package to examine their influences on original CUE by controlling other variables in Eq. 2. Based on the partial relations between original CUE and MAT, segmented linear regressions (also used in previous studies58) were used to identify the threshold values of MAT. The obtained segmented linear regressions were incorporated into microbial-explicit and first-order models (see Section ‘SOC models’ for details) to examine their implications on SOC dynamics in a warmer climate. This approach could be feasible in spatially implicit model runs without accounting for spatial heterogeneity (see the following section of SOC models for details), thus requiring to control the biotic and abiotic factors (see Eq. 2) covarying with temperature in influencing CUE in the partial dependence analysis34. The sensitivity of nonlinear CUE and MAT relations and MAT threshold values were examined by using more datasets of compiled CUE which include 18O-H2O method26 or using MAT_soil.
Effects of substrate and environmental conditions on CUE using detrended CUE
Because CUE was substantially influenced by the type of substrates added (Fig. 2a) and that varied across meta-data studies59, here we used a ‘detrend’ approach to standardize the effects of substrates. The principle of ‘detrend’ was to remove the influence of individual substrate effects on the overall relationship using a partial least squares approach31. As such, CUE measured in incubation conditions with the 16 types of substrates added across studies could be regarded as the systematic study of using the common type of substrates. We then evaluated the thermal response of detrended CUE across the climate gradient—an approach previously used to examine the thermal adaptation of soil heterotrophic respiration from laboratory incubations with a common or single substrate5,6. The detrended CUE with values lower than 0 or higher than 1 (n = 11 out of 826 samples) were not used. The relationship between the detrended CUE and original CUE was examined using the simple ordinary least squares regression. The detrended CUE led to overestimated or underestimated values as compared to the original low or high CUE, respectively, thus generally decreasing the range of CUE values (Supplementary Fig. 1).
As in the analysis of original CUE, simple ordinary least squares linear regressions and random forest models (%IncMSE and a feature partial dependence analysis) were used to examine the dependence of detrended CUE on \({T}_{{incubation}}\) and natural environmental conditions (MAT, F:B ratio, aridity index, SOC and soil C:N). In the random forest models, we have
$${Detrended}\,{CUE}=f({T}_{{incubation}},{MAT},F\!:{Bratio},{aridity\; index},{SOC},{soilC}:N)$$
(3)
Similarly to the approach used for the original CUE, the segmented regressions were used to identify the threshold values of MAT in detrended CUE-MAT relations. The segmented linear regressions were incorporated into microbial-explicit and first-order models to examine their implications of the nonlinear detrended CUE thermal response on SOC dynamics under climate warming. The full CUE datasets including 18O-H2O method26 or MAT_soil were used to examine the sensitivity of nonlinear detrended CUE and MAT relations and MAT threshold values.
The detrended CUE approach standardized the CUE values by controlling the effects of different substrates, thus allowing to further use spatial error models accounting for spatial autocorrelation of sample distribution to examine environmental controls on detrended CUE. The spatial error models used a spatial weights matrix with neighborhoods defined as cells within a certain distance of the focal cell to remove the impacts of the spatial autocorrelation in the residuals (Moran’s I test; all P > 0.05).
Nonlinear thermal response of soil heterotrophic respiration
We used the soil heterotrophic respiration datasets from Dacal et al. and Bradford et al.5,6 to inspect the potential nonlinear thermal response. To this end, we used the random forest analysis and feature partial dependence analysis to investigate the nonlinear thermal response of respiration by controlling the covariates presented in the linear analysis by Dacal et al. and Bradford et al.5,6. Similarly, the segmented regressions58 were performed to identify the threshold values of MAT in correlating with soil microbial mass-specific heterotrophic respiration.
SOC models
We used two soil organic carbon (SOC) models: i) a conventional first-order decomposition model49 and ii) a four-pool microbial-explicit model2 to examine how the CUE-MAT relationships identified in this study (the segmented linear regressions in relating MAT with original or detrended CUE; Supplementary Fig. 4) influence the response of SOC to warming. To do this, we used a space-for-time approach to simulate the effects of CUE under future warming on SOC dynamics3,26. The first-order model includes three C pools, (i.e., SOC, dissolved organic C (DOC), and microbial biomass C (MBC), with each pool’s decomposition rate represented as a first-order decay function. The first-order model lacks an explicit CUE, but the transfer coefficients that indicate flux partitioning into CO2 vs. soil C pools are conceptually comparable2,32,33. The four-pool microbial model adds an enzyme pool (ENZ) with the enzymatic decomposition of SOC and subsequent assimilation (i.e., uptake) of DOC by microbes2 (see Supplementary Fig. 2 for model structure). As such, the four-pool microbial-explicit model allows the microbial pool to feed back to SOC decomposition. To examine the influence of the CUE-MAT relation on respiration and SOC dynamics, only CUE was assumed to vary with MAT in the model parameterization and setup with other variables such as C inputs, climate, and soil conditions being setup as constants. The detailed equations and parameters in the two models can be found in Ye et al. (2019)33.
It is important to emphasize that the model runs did not account for spatial heterogeneity across landscapes where C inputs, climate and soil conditions could vary substantially. To this end, any spatially varying predictor of CUE in Eq. (2) and (3) needed to be considered in partial dependence plots to derive the relationships between original or detrended CUE and MAT while incorporating nonlinear MAT-CUE equations into the biogeochemical models. As such, it leveraged the data-driven machine learning approach to be integrated with biogeochemical models35 while examining the SOC dynamics in a warming climate. To test the sensitivity of this partial dependence approach to covarying abiotic and biotic variables, we considered two scenarios: (1) running several models in each of which we excluded one of different covariates shown in Fig. 2b (i.e., incubation temperature, soil C:N, SOC, aridity index, F:B ratio; Supplementary Figs. 17a–e), and (2) building the model including only F:B ratio and substrate as covariates (Supplementary Fig. 17f).
To assess the thermal sensitivity of decomposition, we ran the SOC models without litter input in the transient scenario by following a unit of C as it is decomposed at different MAT. We defined the effective decomposition rate (effective ke) as an indicator of thermal sensitivity of decomposition at different MAT:
$${k}_{e}=-\frac{{{{\mathrm{ln}}}}\left(\frac{{{SOC}}_{t}}{{{SOC}}_{0}}\right)}{t}$$
(4)
where t is the time that models run, \({{SOC}}_{0}\) is the initial SOC, and \({{SOC}}_{t}\) is the remaining SOC after decomposition within time t. The pattern shown in Fig. 4 refers to the long-term ke values after they have approximately stabilized (i.e., 1 year).