A final sample of 240 cases and 256 controls were identified after application of exclusions (Fig. 1). All cases had HF within the prior year on manual chart review and all controls lacked HF in the year prior to or following the index TTE. Overall, cases (mean ± SD; 74.2 ± 12.1 years, 54.2% female) and controls (75.0 ± 13.0 years, 55.1% female) had a similar age and sex distribution as expected due to matching (Table 1). However, cases were more likely to be Black, (18.3% vs. 6.6%, p = 0.001), had a higher BMI (29.4 ± 7.1 vs. 27.1 ± 5.5, p 1). Additionally, cases had a lower estimated glomerular filtration rate, higher values for NT-proBNP, lower on-treatment cholesterol, and more frequently with cardioactive medications including beta blockers, statins, mineralocorticoid inhibitors, calcium channel blockers, antithrombotics, loop diuretics, and nitrates (all p 1), cases had a greater impairment in systolic function (global longitudinal strain -15.5 ± 4.8 vs. -20.0 ± 2.7, p = 0.009) and diastolic function (Supplementary Table 1; all p 1. However, the control group also demonstrated high rates of concentric remodeling (mean relative wall thickness, 0.48 ± 0.15), left atrial dilation, higher than normal E/e, elevated tricuspid regurgitant velocity, and elevations in NT-proBNP levels, representing a complex clinical cohort. Supplementary Tables 2–3 demonstrate that the difference between the current cohort of cases and controls, compared with those used in the development and original validation of the AI HFpEF model. Generally, the current cohort of cases and controls were the most similar (to each other) across various key clinical characteristics, than in previous datasets. Importantly, the current cohort of controls were older and more commonly had hypertension, structural heart disease, atrial fibrillation, coronary artery disease, diabetes, pulmonary disease, previous cardio- and cerebro-vascular events, and HFpEF “mimics” than in previous datasets, supporting the notion of a far more complex clinical cohort.

Displayed is a flowchart depicting the study selection for cases and controls based on inclusion and exclusion criteria. BIDMC Beth Israel Deaconess Medical Center, LVEF left ventricular ejection fraction, HF heart failure, TTE transthoracic echocardiogram.
Model discrimination and calibration
Discrimination was similar between the AI HFpEF model (AUROC: 0.798, 95% CI 0.756–0.799) and H2FPEF score (AUROC: 0.788, 0.745–0.798, difference: p = 0.71; Fig. 2). Both the AI HFpEF model and H2FPEF score demonstrated similar calibration results. The intercept and slope for the AI HFpEF model (intercept: –0.56, –0.82 to –0.32; slope: 0.44, 0.35 to 0.56) and H2FPEF score (intercept: –1.00, 1.75 to –0.40; slope: 0.81, 0.58–1.15) both indicated an overestimation of risk. For the AI HFpEF model this overestimation was predominant in moderate-to-high probabilities, whereas for the H2FPEF score there was overestimation across the full spectrum of probabilities (Supplementary Fig. 3, Hosmer-Lemeshow, both p
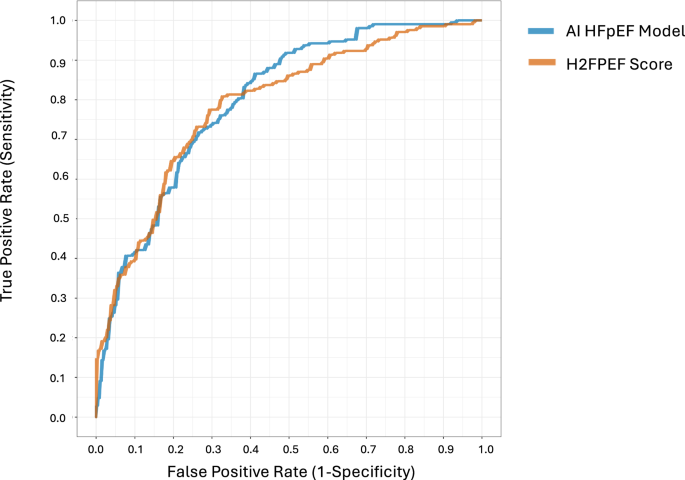
Shown are the receiver operating characteristic (ROC) curves comparing discrimination for identification of HFpEF using AI HFpEF model vs. the H2FPEF score. AI HFpEF is in blue (area under the curve of the ROC [AUROC]: 0.798, [95% CI 0.756–0.799]), and the H2FPEF score is in orange (0.788, ([0.745–0.789])). The difference between the two was not significant (mean difference in AUROC, 0.01, [–0.043–0.064], p = 0.710 using a two-sided DeLong test).
Model classification
Table 2 highlights classification performance for all models. Full confusion matrices are provided in Supplementary Table 4, and comparison of performance across sociodemographic groups, and relevant clinical risk factors in Supplementary Tables 5–10. All three clinical scores provided a “intermediate” classification when there was discordant, or missing information to reliably suggest HFpEF presence or absence. Classification performance is therefore presented when considering all patients (i.e., including intermediate outputs in the calculation of classification statistics; Supplementary Tables 11–12), and when considered only diagnostic outputs (i.e., positive or negative; Supplementary Methods and Supplementary Tables 11–12).
H2FPEF score
The H2FPEF score resulted in 306 (61.7%) intermediate classifications, compared with 75 (15.1%) for the AI HFpEF model. Compared to the H2FPEF score, the AI HFpEF model demonstrated higher sensitivity (mean difference, 26.7%, 17.9–35.4%, p
Owing to the meaningful impact of intermediate classifications on model performance, due either to missing or discordant clinical parameters (detailed in Supplementary Methods), classification was also assessed only in patients with all information available (i.e., true discordance contributing to intermediate classifications, rather than missing data). After removing patients with missing inputs for the H2FPEF score (n = 319 [64.3%]), H2FPEF sensitivity improved (97.5%, 92.5–100%, vs. 86.3%, 79.8–91.2% for the AI HFpEF model), and specificity improved (38.6%, 18.7-53.1% vs. 59.9%, 49.2–70.7% in the AI HFpEF model), despite retaining high intermediate classification rates (61.1% vs. 13.5% in AI HFpEF model; Supplementary Table 11).
Supplementary Table 13 illustrates how performance of the H2FPEF changes as a consequence of the decision threshold. As expected, higher decision thresholds result in lower sensitivity, and higher specificity, and the converse is true for lower decision thresholds. Sensitivity ranged from 3.8% to 98.8%, and specificity ranged from 10.9% to 100%, for thresholds of categorical scores (1–9). Supplementary Table 6 highlights how the AI HFpEF model might compensate for the drop in performance above a score of 6, and below a score of 4 (sensitivity and specificity respectively). Similarly, Supplementary Table 14 demonstrates consistent performance between the AI HFpEF model and the H2FPEF score for comparable decision thresholds according to the continuous probability produced by each model. Additionally, Supplementary Tables 5–10 demonstrate consistent model performance across relevant sociodemographic, clinical, and echocardiographic subgroups of interest.
HFA-PEFF Score
There were 269 (54.2%) intermediate classifications with the HFA-PEFF score. Compared with the HFA-PEFF score, the AI HFpEF model also demonstrated higher sensitivity (by 17.5%, 8.8 to 26.2%, p 13 illustrates how performance of the HFA-PEFF score changes as a consequence of the decision threshold, demonstrating similar performance characteristics as the H2FPEF score. After removing patients with missing inputs for the HFA-PEFF score (n = 246 [49.6%]), sensitivity improved to 100% vs. 87.0% (81.4-92.1%) in AI HFpEF model, but specificity decreased (26.7%, 9.8-42.2% vs. 52.6%, 37.3–69.1% for AI HFpEF model), and intermediate classification rates also decreased (31.3% vs. 14.2% in AI HFpEF model; Supplementary Table 11).
Reclassification and added information
Figure 3 illustrates the reclassification of patients from the H2FPEF Score (panel A) and HFA-PEFF Score (panel B) into the AI HFpEF model, alongside net classification statistics for the AI HFpEF model compared to each score. In the intermediate classified patients according to the H2FPEF score (n = 306), the AI HFpEF model also classified 45 as intermediate, 163 as high likelihood of HFpEF, and 98 as low likelihood of HFpEF. In the intermediate classified patients according to the HFA-PEFF score (n = 269), the AI HFpEF model also classified 48 as intermediate, 139 as high likelihood of HFpEF, and 82 as low likelihood of HFpEF.
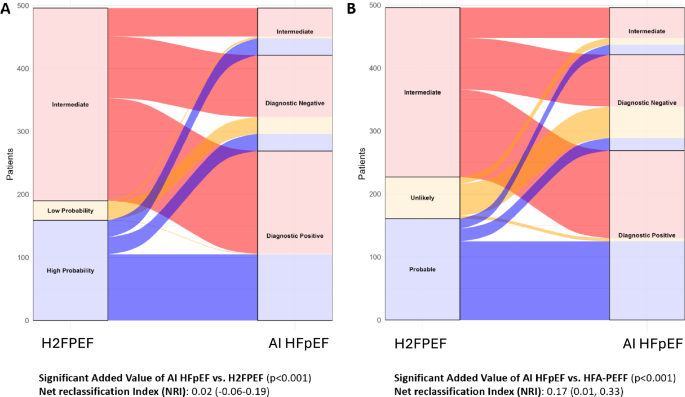
Displayed are alluvial plots depicting the reclassification of predicted HFpEF from clinical scores using the AI HFpEF model. This plot and associated reclassification statistics account for only categorical classification outputs from each model, rather than continuous outputs. Panel A depicts the AI model’s reclassification of an individual’s predicted HFpEF status from the HF2FPEF score. Panel B depicts the AI model’s reclassification of an individual’s predicted HFpEF status from the HFA-PEFF score. The added value of the AI HFpEF model compared with the H2FPEF score and HFA-PEFF score are displayed below the alluvial plots. Two-sided likelihood ratio tests were used to estimate the added value of the AI HFpEF vs. H2FpEF score and resulting p values are presented alongside net reclassification improvement (NRI) statistics. All NRI statistics are based on categorical outputs. Non-diagnostic and indeterminate outputs are referred to as “intermediate” for consistency and clarity.
For the continuous probability output from the AI HFpEF model and the H2FPEF score, the AI HFpEF model provided significantly more information (likelihood ratio test, p 15), and marginally positive discrimination improvement (IDI) index (0.07, 0.00-0.14). However, when utilizing only the categorical outputs from the three models, the AI HFpEF model added significant information to both the H2FPEF and HFA-PEFF scores according to likelihood ratio tests (both p 3 and Supplementary Table 15).
Clinical utility
The clinical utility of integrating the AI HFpEF model into clinical practice was assessed using decision curve analysis18. Making clinical management decisions based on the integration of diagnostic information from the H2FPEF score and the AI HFpEF model was superior to the H2FPEF score alone. Specifically, compared to only using the H2FPEF score, decisions to intervene using all available information resulted to 33% more patients with HFpEF managed correctly, and an absolute 9% reduction in the number of prescriptions without missing any patients with HFpEF; this benefit was highest when clinical scores were used following intermediate AI HFpEF model classifications, rather than the alternative (Fig. 4 and Supplementary Table 16). Comparisons to the HFA-PEFF score demonstrated little difference between approaches (Supplementary Fig. 4). Modeling of combined continuous probabilities (AI HFpEF model and H2FPEF Score) and categorical classification (HFA-PEFF Score) supported the notion of added clinical utility when integrating information from all available diagnostic methods (Supplementary Table 16).
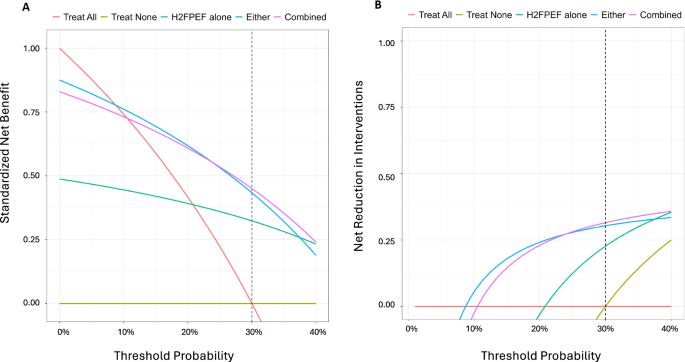
Decision curves comparing the standardized net benefit (panel A) and net reduction in interventions (B) when patient management decisions are based on the output of the H2FPEF score and/or the AI HFpEF model. The management decision is assumed to represent prescription of SGLT2i to the patient, in a population where the expected prevalence of HFpEF is 30%. Red and gold lines represent clinical baselines of prescribing all patients or no patients SGLT2i, respectively, regardless of the output of any test. Prescribing based on only the H2FPEF score (green), represents that any patient with a “Probable” classification of HFpEF would be prescribed SGLT2i. Prescribing based on either a “Probable” (H2FPEF) or “Positive” classification (AI HFpEF) is presented in blue. Prescribing based on the combination of a “Positive” classification (AI HFpEF), or “Intermediate” (AI HFpEF) and “Probable” (H2FPEF) is presented in purple. The x-axis represents the threshold probability that would be required by a clinician and/or patient to initiate prescription of SGLT2i. In this context, the chosen minimum threshold probability is 30% (dotted line), representing the relative harm of an adverse event when taking SGLT2i (5.8%41), and the risk reduction associated with taking an SGLT2i (−19%41 for HF hospitalization or worsening HF event). The x-axis is truncated to clinically reasonable threshold probabilities for clear and meaningful interpretation. For net benefit plots, the y-axis refers to the standardized net benefit of taking a given approach, with units presenting the proportions of patients with disease in the population who would be successfully managed according to the different approaches. For example, a value of 0.45 for the Combined approach would be interpreted such that, compared to prescribing no patients with SGLT2i, managing patients based on the combined information from the AI HFpEF model and the H2FPEF score would result in 45% of patients with HFpEF being correctly managed. For net reduction in interventions, a value of 0.315 for the Combined approach would be interpreted such that, prescribing SGLT2i based on the combined information would lead to an absolute 31.5% reduction in the number of prescriptions without missing any patients with HFpEF.
Patient outcomes
During a median (IQR) 25 (15–35) months follow-up, there were 45 HF hospitalizations (10.3%), and 61 deaths (14.2%). A diagnostic positive result according to the AI HFpEF model was associated with a two-fold risk of the primary composite endpoint (Fig. 5, Supplementary Table 17, HR 2.56, 1.46–4.51, p = 0.001 vs. diagnostic negative output), risk for mortality (HR 2.54, 1.27–5.05, p = 0.008), and three-fold higher risk of HF hospitalization (HR 3.15, 1.33–7.47, p = 0.009). The same association was present for quartiles of risk according to the continuous probability of HFpEF from the AI HFpEF model. Compared to the first quartile, risk of the composite outcome (HR 3.95, 2.00–7.81, p 18). Similar associations were also present for the clinical scores (Supplementary Table 17; Supplementary Figs. 5–6), but there was no significant association between the AI HFpEF model and risk of outcomes in intermediate classified patients according to the H2FPEF and HFA-PEFF scores (Supplementary Table 19).
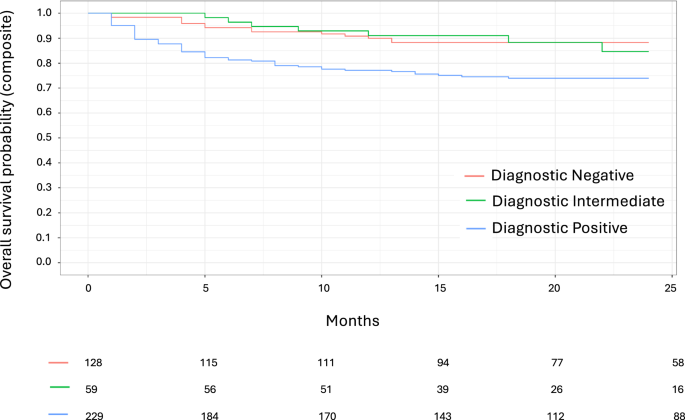
Shown are Kaplan-Meier curves for time (in months) from the index echocardiogram to the composite outcome of death or heart failure hospitalization according to the AI HFpEF model’s predicted classification. Red = diagnostic negative, green = intermediate (“non-diagnostic” due to high uncertainty), and blue = diagnostic positive. Number of individuals in the risk set at 5-month time intervals is provided below the x-axis.