Over the past 4.5 years, I’ve spent around 4 million HUF (~$11,000) on groceries – and 150,000 HUF (~$400) of that went to lactose-free cream alone. Also, I bought 223 cucumbers. 🥒 Meanwhile the price of butter nearly doubled.
I downloaded my grocery loyalty card data and turned it into an animated story. Surprisingly fun to make – unlike the actual inflation it shows. 🫠
I’m wondering, has anyone else looked into their own data from sources like this? Not just grocery stuff, maybe from Uber, Revolut, food delivery apps, and so on?
(data source – Lidl Plus app, visualization – Vizzu app)
Impressive work! What trends or patterns stood out to you the most over the 4.5 years?
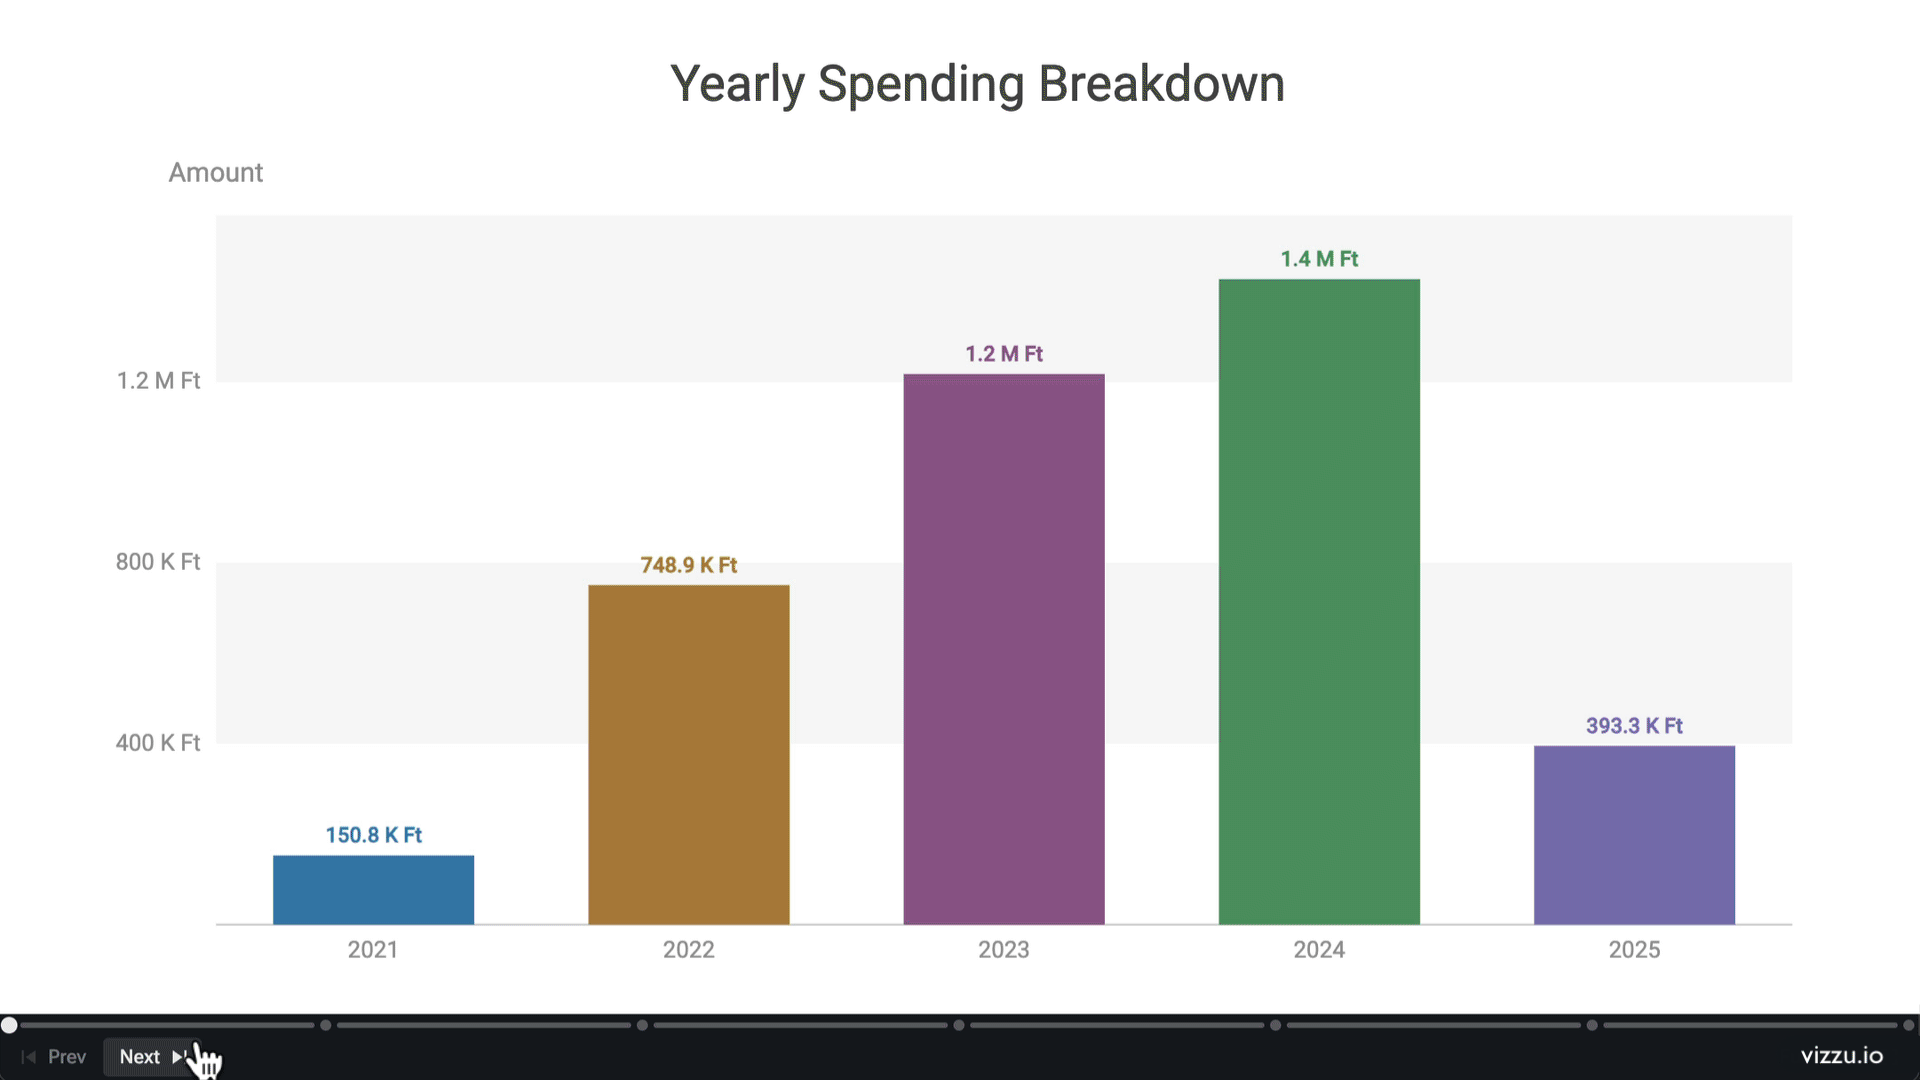
![[OC] 4.5 Years of Grocery Data Visualized](https://www.europesays.com/wp-content/uploads/2025/03/u1dqdzqsy8re1-1920x1024.gif)
2 comments
Over the past 4.5 years, I’ve spent around 4 million HUF (~$11,000) on groceries – and 150,000 HUF (~$400) of that went to lactose-free cream alone. Also, I bought 223 cucumbers. 🥒 Meanwhile the price of butter nearly doubled.
I downloaded my grocery loyalty card data and turned it into an animated story. Surprisingly fun to make – unlike the actual inflation it shows. 🫠
I’m wondering, has anyone else looked into their own data from sources like this? Not just grocery stuff, maybe from Uber, Revolut, food delivery apps, and so on?
(data source – Lidl Plus app, visualization – Vizzu app)
Impressive work! What trends or patterns stood out to you the most over the 4.5 years?
Comments are closed.