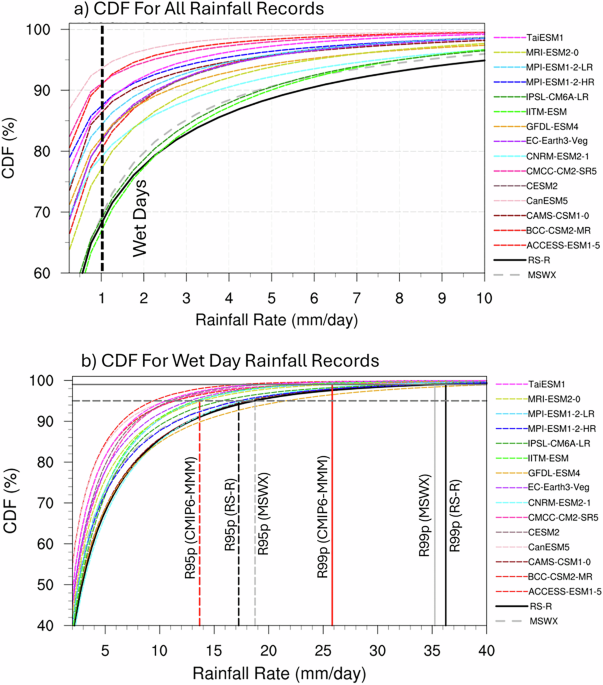
Figure 1 shows the cumulative distribution functions (CDFs) of precipitation over the AP during the 1985–2014 wet season, derived from the Red Sea Reanalysis (RSRA), Multi-source Weather (MSWX) data, and CMIP6 models. In both the RSRA and MSWX data, 70% of the rainfall records over the AP correspond to non-wet days. In the remaining 30% of the records attributed to wet days, the rainfall is usually below 10 mm (Fig. 1a). More specifically, the proportions of wet days with rainfalls of 1–5 mm, 5–10 mm, and >10 mm are 21%, 4.5%, and 4.5%, respectively (Fig. 1a). As the CDFs derived from the RSRA and MSWX datasets are very similar, the RSRA was adopted as the reference precipitation dataset in this study. On average, approximately 18% of the simulated rainfall records are wet (Fig. 1a), with 13%, 2.5%, and only 2% in the rainfall ranges of 1–5 mm, 5–10 mm, and >10 mm, respectively (Fig. 1a). Therefore, a drizzle-like bias exists in most CMIP6 models, as observed in previous CMIP phases29,30,31,32.
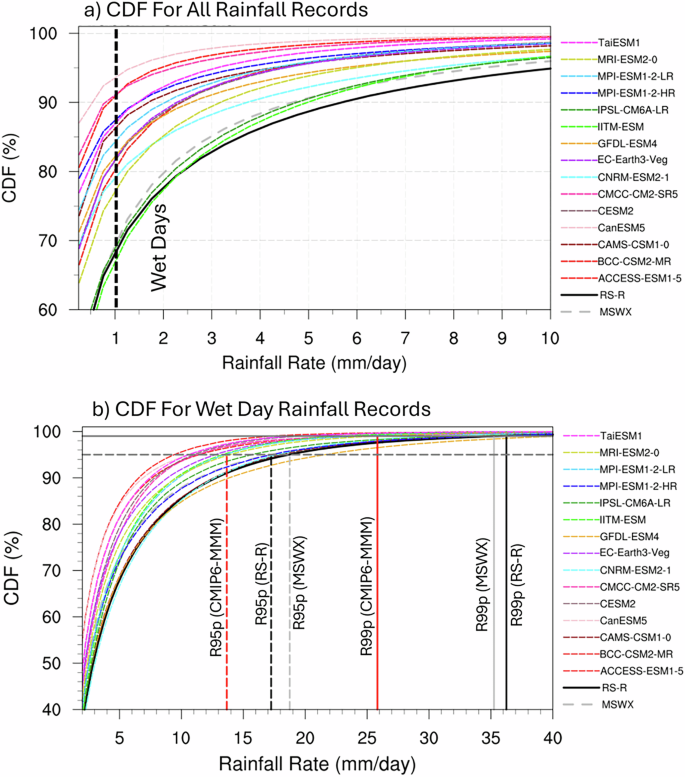
CDFs for (a) all precipitation records and (b) wet-day precipitation records across various precipitation bins (mm/day) over the AP during the historical wet season (1985–2014). In panel (a), the vertical dashed line marks the threshold for wet days. In panel (b), the vertical solid and dashed lines indicate the 99th percentile (R99p) and 95th percentile (R95p), respectively, for the CMIP6 multimodel mean (CMIP6–MMM; red), RS-R (also called RSRA in black), and MSWX (gray). The horizontal gray solid and dashed lines show the 99% and 95% CDFs, respectively. The colored curves represents the CDFs of individual models (as labeled on the right).
Based on the precipitation CDFs on wet days over the AP, the R95p and R99p thresholds of RSRA were determined as 18 and 36 mm, respectively (Fig. 1b). The occurrences of R95p EPEs from RSRA are highest along the coastal Red Sea and Arabian Gulf and over the southwest and interior AP, where approximately 30 events occurred in 30 years (Fig. 2a). In contrast, regions such as Rub’ al Khali and the northernmost AP experienced only around 6–8 EPEs in 30 years. These regions with high and low R95p EPE occurrences are associated with high and low wet-season rainfall, respectively (e.g., Abdullah and Almazroui11; De Vries et al.15,22; Dasari et al.14). The R95p EPEs from the CMIP6 multi-model mean (CMIP6–MMM) show a comparable pattern across the AP, with a correlation of 0.75 against the RSRA, but exhibit systematic biases, particularly over regions with relatively more frequent EPEs (Fig. 2b, c). These EPE biases are likely caused by the underestimation of heavy rainfall days in the CMIP6 models (Fig. 1a and Supplementary Fig. 1).
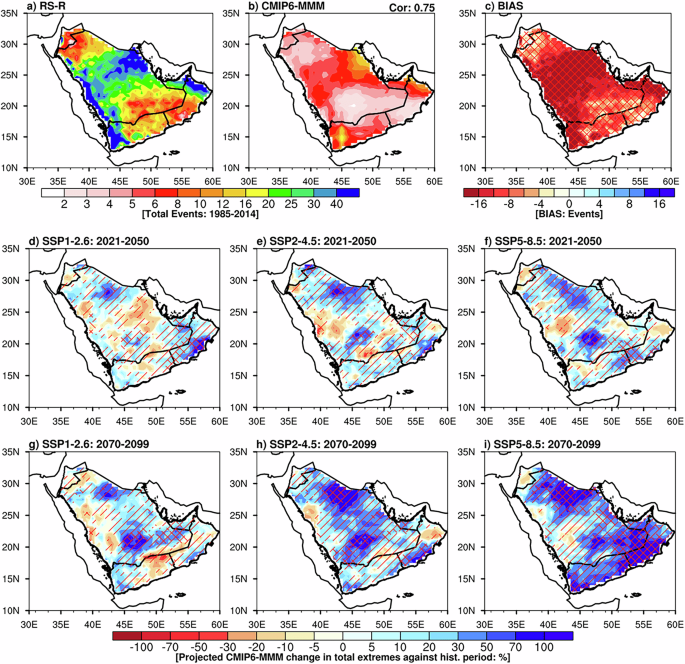
Spatial maps of total extreme events during the wet season (1985–2014) based on the R95p threshold for (a) RSRA (RS-R) and (b) CMIP6–MMM. Panel (c) shows the bias in total extreme events between CMIP6–MMM and RSRA. Panels (d–f) and (g–i) show projected percentage changes in extreme events for the near-future (2021–2050) and far-future (2070–2099), respectively, under three climate scenarios (SSP1-2.6, SSP2-4.5, and SSP5-8.5). A backward slash \((\backslash )\) indicates significant changes/biases at the 95% confidence level based on a two-tailed Student’s t-test. A forward slash \((/)\) indicates that at least 60% of the CMIP6 models agree on the sign of the changes/biases. Hatches marks area where both conditions (backward and forward slash) are met, indicating robust change/bias regions.
Assuming that biases in the CMIP6 model will persist in future climate simulations, we estimated the projected changes in the R95p EPEs for CMIP6-MMM under three shared socioeconomic pathway (SSP) scenarios (SSP1-2.6, SSP2-4.5, and SSP5-8.5) during the near-future (2021–2050) and far-future (2070–2099) (Fig. 2d–i). Although all SSPs predicted increasing/decreasing EPE patterns in the near-future, the higher emission scenarios predicted a wider area of increasing patterns than the other scenarios (Fig. 2d–f). The R95p EPEs over the AP are projected to decrease up to 20% from their current level in some patches while increasing by 20–50% (depending on emissions level) over a wider area. The area of increased EPEs is expected to further expand in the far future, reaching 70% over the northwest AP and Rub’ al Khali (SSP2-4.5) and 100% over the northwest, southeast and southwest AP (SSP5-8.5) (Fig. 2g–i). Notably, the changes reported for CMIP6-MMM align closely with those obtained from the multi-model mean of the NASA Earth Exchange Global Daily Statistically Downscaled CMIP6 Projections33 (NEX-GDDP-MMM), supporting CMIP6-MMM changes. NEX-GDDP-MMM indicates a ~50% increase in EPEs during the near future and an over 100% increase in the far future under SSP5-8.5 (Fig. 3). Aside from small pockets along the coastal Red Sea and the northern AP exhibiting minor decreases, the rest of the region shows more substantial increases compared to CMIP6-MMM (Fig. 2d-f and Fig. 3d-f). These patterns persist across all scenarios, with SSP5-8.5 showing the highest increases, while the other scenarios display similar trends but with slightly lower magnitudes than SSP5-8.5. A recent observational study reported a decreasing trend in frequency but an increasing trend in the intensity of EPEs over Jeddah, located on the Red Sea coast17. This change is potentially linked to urbanization in the area18.
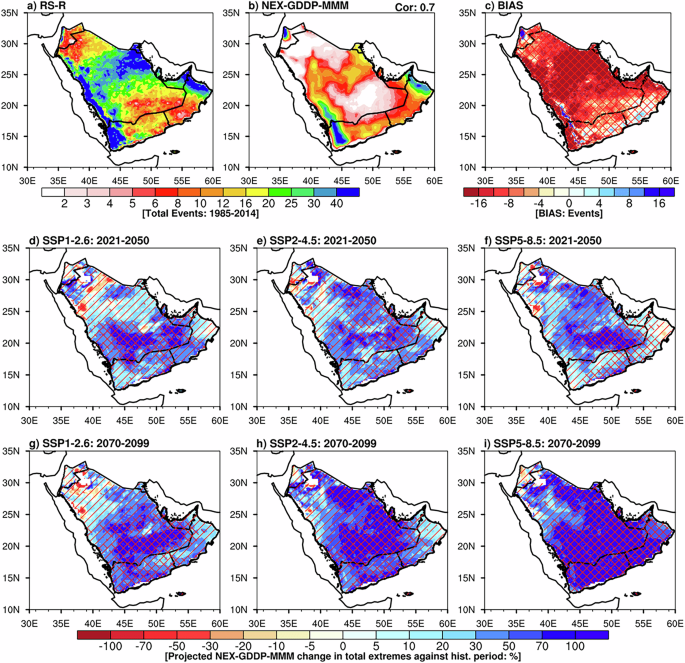
Spatial maps of total extreme events during the wet season (1985–2014) based on the R95p threshold for (a) RSRA (RS-R) and (b) NEX-GDDP–MMM. Panel (c) shows the bias in total extreme events between NEX-GDDP–MMM and RSRA. Panels (d–f) and (g–i) show projected percentage changes in extreme events for the near-future (2021–2050) and far-future (2070–2099), respectively, under three climate scenarios (SSP1-2.6, SSP2-4.5, and SSP5-8.5). A backward slash \(({\rm{\backslash }})\) indicates significant changes/biases at the 95% confidence level based on a two-tailed Student’s t-test. A forward slash \((/)\) indicates that at least 60% of the NEX-GDDP models agree on the sign of the changes/biases. Hatches marks area where both conditions (backward and forward slash) are met, indicating robust change/bias regions.
Rarer events (i.e., R99p EPEs) exhibited a similar pattern to R95p EPEs, with occurring four events over most of the AP and approximately 10–20 events over the coastal Red Sea and Arabian Gulf regions over 30 years (Supplementary Fig. 2). Like R95p, the spatial patterns of the R99p EPEs in the CMIP6–MMM are comparable to those of RSRA (correlation = 0.60), showing a bias in the order of the mean. Future projections indicate a higher increase rate of R99p EPEs, potentially exceeding the current level by more than 200% in SSP5-8.5. This finding is in line with previous research suggesting that increasing anthropogenic emissions will increase the frequency of rare events in future (e.g., Masson-Delmotte et al.1; Gründemann et al.34).
To better interpret these changes in the context of warming, we normalized the projected changes in EPEs by the surface air temperature increases during the same period. For R95p extremes, we found a ~ 20% increase per oC rise in surface temperature by the end of the century, while for R99p extremes, the increase was ~50% per oC under SSP5-8.5 (Supplementary Figs. 3 and 4). To put it in perspective, the Clausius–Clapeyron (CC) scaling hypothesis posits that rising temperatures enhance the atmosphere’s moisture-holding capacity, leading to more intense precipitation events35,36. The projected 20% to 50% per oC increase in the intensity of future extreme events (Supplementary Figs. 3 and 4) actually exceeds the CC-scaling, and is consistent with the proposed super-CC relationship37,38,39. The concept of super-CC scaling suggests that the dynamic feedback between enhanced updrafts, latent heat release, and low-level moisture convergence plays a paramount role in generating precipitation rates that surpass those predicted by CC scaling. The broader applicability and limitations of CC and super-CC scaling for extremes over AP will be examined in a separate study due to their complexity.
Time-series Changes in EPE Frequency and Precipitation Contribution
Figure 4 shows the CMIP6–MMM historical and projected yearly changes in EPEs over the AP and its sub-regions under the highest-emission scenario (SSP5-8.5), relative to the historical mean of 1985–2014. The AP sub-regions (Fig. 4a) classified using wet-season rainfall variability and spatial rainfall autocorrelation-based clustering (e.g., Saikranthi et al.40), align with the identified homogenous regions in the Kingdom of Saudi Arabia (KSA)41. Over time, both the R95p and R99p EPEs gradually increased over the whole AP, including the KSA and the six sub-regions (Fig. 4b, c). The CMIP6-simulated historical variation of EPE changes over the AP resembles that of the RSRA, inspiring confidence in the projected trend (Supplementary Fig. 5). However, the models deviate from the RSRA trends in specific periods, likely reflecting internal variabilities42.
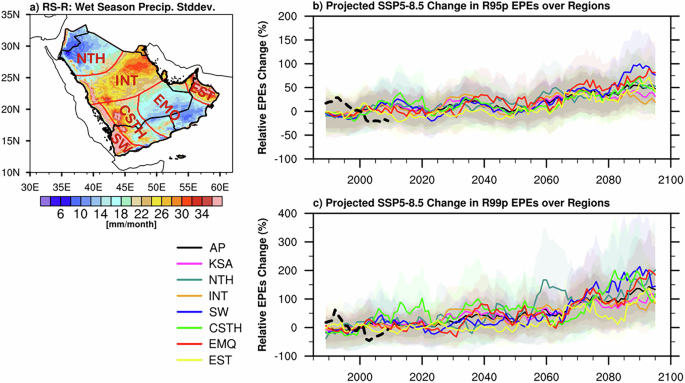
Future changes in EPEs (%) relative to the historical mean (1985–2014) across the Arabian Peninsula (AP), the Kingdom of Saudi Arabia (KSA), and six sub-regions (panel (a)) under the SSP5-8.5 scenario. The graphs display EPE changes in the CMIP6 models and RSRA (RS-R) at the thresholds of (b) R95p and (c) R99p. The sub-regions are defined based on wet-season rainfall variability and spatial rainfall autocorrelation, closely aligning with homogeneous regions in the KSA identified by Almazroui et al.41 using a principal component analysis with multiple variables. The six subregions of the AP are as follows: Northern (NTH), Interior (INT), Southwest (SW), Central South (CSTH), Empty Quarter (EMQ), and Eastern (EST). The curves in panels (b) and (c) represent the multi-model means of projected changes from the historical average (1985–2014), smoothed using a 10-year running average. The shaded area around each curve indicates the likely range (half deviation) of projected changes in the corresponding CMIP6 model. The black dashed line shows the historical change in RSRA.
The rare events (R99p EPEs) are increasing at a faster yearly rate than the less intense rainfall events (R95p EPEs) (Fig. 4c). By the end of the 21st century, the R95 EPEs are projected to increase by approximately 50% over most AP regions while the R99p EPEs will increase by over 100%, reaching up to 200% in some regions. The most substantial trends are projected in the southwest, empty quarter, and central south, where the R95p EPEs and R99p EPEs are expected to increase by 50–100% and 100–200%, respectively (Fig. 4b, c). Although they follow the CMIP6–MMM changes, the CMIP6 models show a wide range of inter-model uncertainty in the R95p and R99p EPE projections, which increase over time. This inter-model spread in the simulated precipitation highlights the need for further enhancement of the models (e.g., Almazroui et al.43; Masson-Delmotte et al.1; Pathak et al.44).
Figure 5 shows the contribution of EPEs to the wet-season rainfall under the SSP5-8.5 scenario. During the historical period, the CMIP6–MMM overestimated the contribution of low rainfall events and underestimated the contribution of intense rainfall events from those of RSRA. In CMIP6–MMM and RSRA, rainfall events below 5 mm contributed 40% and 50%, respectively, those between 10 and 20 mm contributed 22% and 17%, respectively, and those between 20 and 40 mm contributed 14% and 8%, respectively. Rainfall events between 5 and 10 mm contributed 20% in both models. Extreme events (rainfall above 40 mm) contributed 5% in RSRA but only 2% in CMIP6–MMM (Fig. 5b). That is, CMIP6 models tend to overestimate and underestimate low and heavy rainfall events, respectively, as also reflected in their probability distribution function over the AP. SSP5-8.5 predicts that in the far future, the EPE contributions from 20–40 mm and >40 mm intense-rainfall events over the AP will increase by approximately 30% and 125%, respectively, from their current levels. Conversely, contributions from low-rainfall events are projected to decrease by approximately 12%. Significant increases in the contributions of intense rainfall events are also expected in regions. The projected increases of events with over 40 mm of rainfall are 150% in the southwest, 125% in the north, and 100% in the central southern AP (Fig. 5c). In the far future, the contributions of 20–40 mm events will increase by 25–50% across various regions, whereas those of low-rainfall events are projected to decrease by 10–20% from their current levels in these regions (Fig. 5c). Specifically, in the KSA (which accounts for 80% of the AP area), the expected increases of >40 mm and 20–40 mm events are 85% and 30%, respectively, while low rainfall events (4c). However, compared to the historical period, the uncertainty in projections for heavy rainfall events (>40 mm) decreases in the far future. In particular, for smaller events (40 mm), this ratio decreases from approximately 45% in the historical period to 30% in the far-future SSP5-8.5 scenario, suggesting for most models to consistently project more frequent and intense EPEs under future warming (Supplementary Fig. 6).
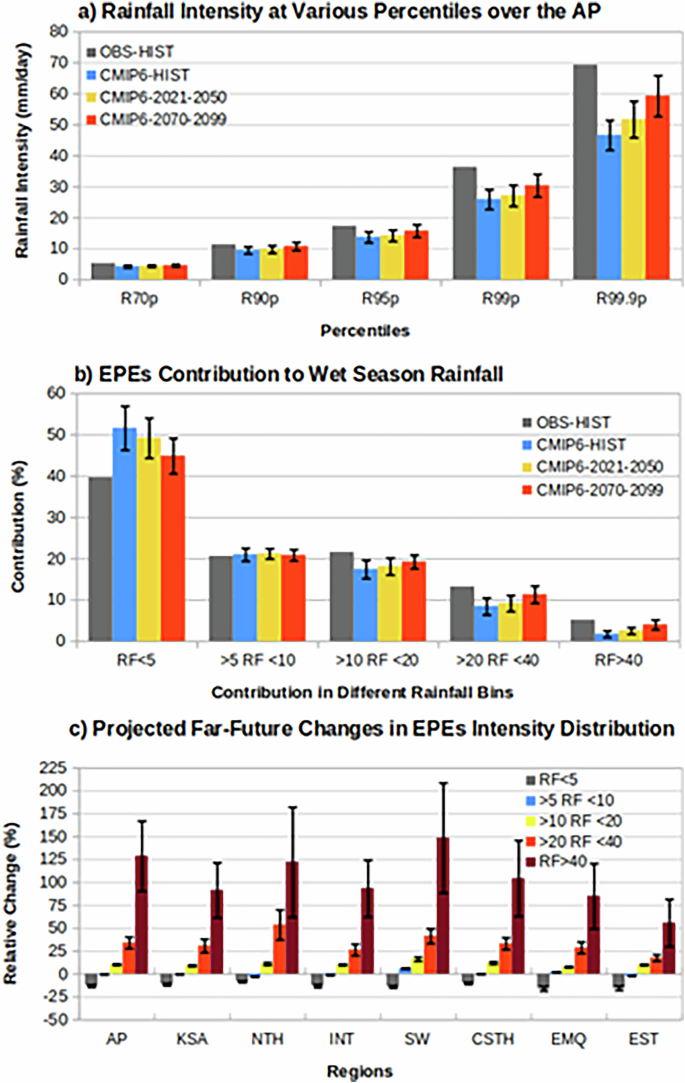
a Intensity variations of different rainfall percentiles during the historical wet season (1985–2014) over the AP, as observed in RSRA (OBS-HIST) and CMIP6–MMM. This include projections for the near-future (2021–2050) and far-future (2070–2099) periods. b Historical and future variations in extreme rainfall contributions across different rainfall bins, relative to the total wet-season rainfall over the AP, as obtained by RSRA and CMIP6–MMM. c Projected far-future changes in rainfall contributions across different rainfall bins, relative to the total wet season rainfall, for the Whole AP, the KSA, and six sub-regions.
Besides increasing in frequency and percentage contribution, EPEs are expected to increase in intensity (Fig. 5a). The EPEs at thresholds of R95p, R99p, and R99.9p are projected to intensify by 20–30% in the far future, with higher intensity changes at higher percentiles (Fig. 5a). The increases in frequency and intensity of EPEs are projected to substantially contribute to the 50–60% expected increase in mean annual rainfall under the SSP5-8.5 scenario by the end of the 21st century43.
Historical Mean Large-scale Circulation Characteristics
To investigate the dominant large-scale circulations causing EPEs over the AP and the responses of these circulations to precipitation changes, we first analyzed the historical mean wet-season circulations, then performed historical and far-future composite analyses of the R95p EPEs under the high-emission scenario. The MRI-ESM2-0 model, which best simulated the EPEs and precipitation seasonality over the AP (Table 1 and Supplementary Fig. 7–10), was employed in this analysis. The MRI-ESM2-0 model adequately reproduces the historical circulation patterns of ERA5 and aligns well with those from CMIP6–MMM (Supplementary Fig. 11, 12). Consequently, the model is well suited for revealing both the historical and future circulation patterns during EPEs. This analysis focuses on the wet-season EPEs over the interior of the AP (IAP), which receives over 90% of the annual precipitation over the whole AP (Supplementary Fig. 10). The number of EPEs in the IAP is surpassed only in the southwest region, which receives both EPEs and substantial rainfall during the summer season, in addition to the wet season (Fig. 2). This region will be the focus of further investigation in subsequent studies.
Importantly, during the historical period, the low-level wind patterns at 850 hPa show two anticyclonic circulations: one over the Africa and another over the AP adjoining the Arabian Sea (Fig. 6a). The northwesterly and southwesterly winds merge to form the RST, a low-pressure zone between the two anticyclonic circulations that converges over the central Red Sea and the adjoining AP (Fig. 6a). As shown in the upper-level wind patterns at 200 hPa, the SWJ traverses the AP at approximately 45 m/s (Fig. 6b, c). Acting as a waveguide of westerly disturbances, the STJ is a crucial precipitation generator in the region14,28,45,46. Its position is identified by extracting the maximum zonal wind velocity between 10°N and 40° N at all longitudes from 20°E to 70°E. The low-level vertical wind at 850 hPa shows subsidence over most desert areas and patches of ascent over the interior, southwest, and western mountainous regions of the AP (Fig. 6b).

b Vertical wind at 850 hPa overlaid with 200 hPa horizontal wind vectors. c The 200 hPa zonal wind component, with the black line indicating the core position of the subtropical jet (STJ). Panels (d–f) show composite anomalies during historical extreme events, while (g–i) depict anomalies during far-future extreme events (2070–2099). The STJ position was determined by extracting the maximum wind velocity between latitude bands 10°N and 40°N at all longitudes from 0°E to 80°E (see Attada et al.45). The black, blue, and purple lines in panels (c), (f), and (i) indicate the core STJ positions during the historical mean wet period, historical extreme precipitation event (EPE) days, and far-future EPE days, respectively.
Historical EPE Composites
The composite anomalies of low-level wind (Fig. 6d) show an anomalous cyclonic circulation over the AP (Fig. 6d) that advects moisture from nearby water bodies into the AP (Fig. 7b, h). This cyclonic circulation coincides with an area of anomalously low SLP extending the RST from the southwest to northeast AP (Fig. 6d). Together with the anomalous cyclonic circulation, the SLP draws warm moist air from the Red Sea, the Arabian Sea, the Arabian Gulf, and the eastern Mediterranean Sea during an EPE21,22,26,27.
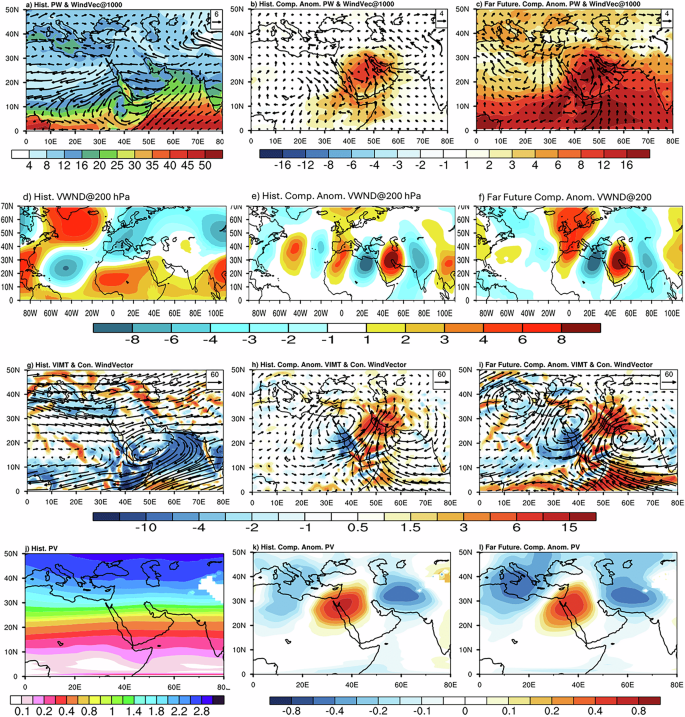
(a–c) Contours of total precipitable water from surface to 400 hPa, overlaid with wind patterns at 1000 hPa: (a) climatological mean conditions during the wet season, (b) composite anomalies of historical EPEs, and (c) composite anomalies of far-future EPEs. The second row (d–f) presents results from meridional wind at 200 hPa; third row (g–i) shows integrated moisture convergence from 1000 to 400 hPa; and the fourth row (j–l) depicts potential vorticity. In the moisture convergence plots (g–i), contours are overlaid with wind vectors illustrating integrated horizontal moisture advection.
These dynamic mechanisms are strongly complemented by thermodynamic factors, which paly a critical role in enhancing upward motion during EPEs47. The composite anomalies of moist static energy (MSE) in historical EPEs show positive value over the AP, primarily confined to the lower troposphere (Supplementary Fig. 13). This localized increase in MSE corresponds to a favorable environment for instability and convection, driving upward motion. Specific humidity anomalies further enhance this effect, with positive anomalies over the AP and surrounding water bodies supplying abundant moisture (Supplementary Fig. 14). This moisture fuels latent heat release during convection, which directly reinforces upward motion (Supplementary Fig. 15). The composite anomaly of low-level vertical velocity highlight these effects, showing upward motion extending to mid-tropospheric levels (Fig. 6e). The thermodynamic contributions of increased MSE, humidity, and relatively more warmed mid-troposphere amplify this dynamical lifting, making it important for generating extreme precipitation45.
The composite anomalies of upper-level wind indicate a southward shift of the STJ from its normal position during an EPE (Fig. 6f). This southward shift induces baroclinicity and increases the frequency of transient passages and hence the moisture flux entering the IAP from adjacent seas, leading to extreme rainfall14,27. The number of transient activity occurrences over the IAP also increases during EPEs (Supplementary Fig. 16, 17). The STJ shift can generate a vorticity source for Rossby wave formation, forming a low-level local vorticity46 that assists the uplift of high-moisture flux from the surrounding seas48. The low-level cyclonic circulation anomaly during EPEs in the IAP features an upper-level cyclonic anomaly with a slightly westward-shifted center from that of the low level (Fig. 6d, e). In addition, a wave-like pattern in the meridional wind composite anomaly at 200 hPa in the mid-latitude region (Fig. 7e), which is recognized as a CGT, extends eastward from the North Atlantic Ocean toward Europe and South Asia, where it likely affects the regional precipitation49,50. The CGT pattern can modulate mid-latitude storms51 and brings cold air in the upper troposphere over the AP during the wet season, facilitating upper air divergence through the jet stream and helping to develop the MCSs, as discussed by Branstator49.
The vertically integrated moisture transport (VIMT) composite-anomaly analysis of the historical EPEs reveals that moisture flux is primarily transported from the Red Sea and Arabian Sea (Fig. 7h). The Arabian Anticyclone transfers moisture from these water bodies to the IAP. Meanwhile, westerly winds transport substantial amounts of moisture from the eastern Mediterranean to the north–central AP. Past studies have associated upper-level cyclonic circulation and anticyclonic circulation with enhanced and suppressed potential vorticity, respectively23,52,53,54. The strong flow induced by the synoptic-scale upper-level potential vorticity can generate cyclonic circulation at lower levels. During EPEs, the 300-hPa potential vorticity composite shows an equatorward intrusion of higher potential vorticity air (>1 potential vorticity unit or 1 × 10⁻⁶ km2/kg/s) from northern latitudes toward the AP, promoting moist convection development (Fig. 7k). Such high PV intrusions are tied to Rossby wave-breaking activities15,46. The southward intrusion of high potential vorticity reduces the atmospheric static stability, inducing further convection55 that favors EPE occurrences. The RST is accompanied by an upper tropospheric trough that destabilizes the atmosphere, leading to MCS development over the region15,17,22. The development of such a system is evidenced by the strong negative OLR anomalies (Supplementary Fig. 18b) and positive total cloud fraction anomalies (Supplementary Fig. 18e) over the IAP. These mechanisms drive EPEs over the IAP, causing an average rainfall of approximately 10 mm across most of the AP with maxima centered over the IAP (Supplementary Fig. 18h).
Far-Future EPE Composites
The projected far-future EPE composite anomalies show notable changes, and circulation shifts from those of the historical EPEs. The STJ, a crucial driver of precipitation in the region, is projected to shift slightly further southward and strengthen over the AP (Fig. 6i). This strengthening is consistent with Hunt (2024), who reported that STJ intensification would increase the westerly disturbances. As the STJ strengthens, the baroclinicity increases and transient passages become more frequent, enhancing the moisture flux into the IAP from adjacent seas and intensifying the rainfall (Fig. 7c, i). Future transient activity over the AP, including the IAP, is projected to increase from that of historical EPEs (Supplementary Fig. 16). The CGT pattern that modulates mid-latitude storms is weakening in the Atlantic Ocean but strengthening over Europe and the Middle East, also consistent with faster transient-activity passages and the southward-shifted and strengthened STJ27.
The far-future vertical wind ascent covers a larger area than in the historical period (Fig. 6h), indicating that the extent of dynamical lifting and amount of potential instability will increase in future26,45. This is evident from relatively large increases in MSE (Supplementary Fig. 13), humidity, and steepened lapse rate in the troposphere (Supplementary Fig. 14, 15), enhancing vertical ascent and causing increased convective activities and more frequent EPEs. A slight strengthening of the upper-level cyclonic anomaly is also expected (Fig. 6h), but the low-level cyclonic anomaly should remain similar to the historical anomaly apart from a low-pressure enhancement over the western Arabian Sea and RST (Fig. 6g). An enhanced high-pressure anomaly and anticyclonic circulation wind anomaly are projected over a larger area on the northern side of the AP, covering Europe to central Asia. This anticyclonic circulation wind anomaly is an extension of the Arabian and African Anticyclone, which moves northward and merge. The enhanced low SLP anomaly and the increased north–south SLP gradient will probably enhance the moisture transport from the Red Sea and Arabian Sea into the AP, and from the Mediterranean Sea through the northwesterly wind (Figs. 5g, h and 6c, i). The far-future VIMT composite indicates a substantial increase in moisture convergence over the IAP, with increased moisture transport from the Red Sea, Arabian Gulf, and eastern Mediterranean (Fig. 6i).
Furthermore, the negative OLR composite anomalies over the IAP in the historical EPEs are projected to expand in the far-future, suggesting heightened instability and a strengthened MCS (Supplementary Fig. 18c). The increased instability coincides with the projected widespread anomalous precipitation over the AP from EPEs (Supplementary Fig. 18i), which is maximized near the Arabian Gulf. A substantial increase in precipitable water is expected in the far future EPEs, potentially doubling from that in the historical EPEs (Fig. 7c). This increase suggests a higher atmospheric moisture content driven by increased local convection in a warmer world.
Overall, the atmosphere of the AP will likely become more dynamic and moisture-laden in the far-future, leading to more intense and widespread EPEs over the AP, particularly in the IAP region.