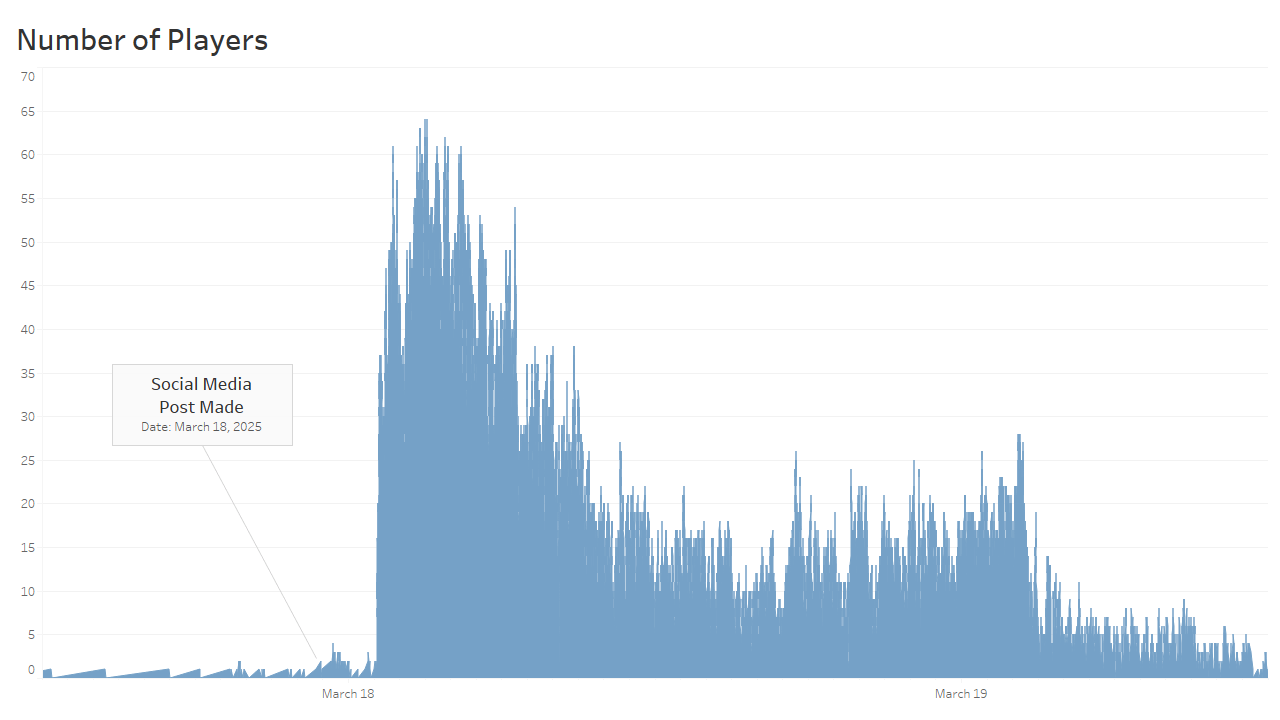
Great visualization! How did you track the concurrent player data?
Why does it grow smoothly like that at the beginning? It should jump from 0 to 1 to 2 or whatever, it looks like you have fractions in the data which does not make sense since you’re counting people. Is the y axis thousands of people?
2 comments
Great visualization! How did you track the concurrent player data?
Why does it grow smoothly like that at the beginning? It should jump from 0 to 1 to 2 or whatever, it looks like you have fractions in the data which does not make sense since you’re counting people. Is the y axis thousands of people?
Comments are closed.