Figure 1a shows the morphology of the synthesized ZrSS NCs, and most of the particles are nearly spherical-shaped, with a size distribution concentrated around 45 nm. The chemical properties of the ZrSS NCs were characterized by ATR-FTIR (Fig. 1b). There are two new peaks at 1633 cm–1 and 1076 cm–1 that correspond to the Amide I and C–OH stretching in the ZrSS NCs spectrum, compared to the spectrum of ZrO2 nanoparticles (NPs)26,27. These two peaks validate that sericin silk (SS) was successfully grafted on the surface of the ZrO2 NPs. In addition, compared to the Amide I and C–OH stretching peaks in SS, the positions of these two peaks in ZrSS NCs have blue-shifted. This shift could be attributed to the formation of hydrogen bonds between ZrO2 NPs and SS9,25. The chemical properties of the ZrSS NCs were further confirmed by the XPS (X-ray Photoelectron Spectroscopy) technique. As shown in Fig. S3, peaks corresponding to Zr, O, C, and N elements are clearly recognized on the ZrSS NCs spectrum. The presence of N further confirms the effective modification of SS on ZrO2 NPs. Deconvolution of O1s core-level spectrum of ZrO2 NPs and ZrSS NCs are depicted in Fig. 1c. In the spectrum of ZrO2 NPs, the binding energies for Zr–O–Zr and Zr–O–H are 529.3 eV and 531.07 eV, respectively 28. There is also a binding energy for H–O–H at 532.7 eV, which may be caused by the absorption of moisture from the air. Compared to the ZrO2 NPs, the spectrum of ZrSS NCs exhibits a new peak at 532.3 eV, corresponding to the O–C=O and O–C=N group, demonstrating the presence of SS in the ZrSS NCs29. Moreover, the peaks of Zr–O–Zr and Zr–O–H have shifted towards lower binding energies. This shift is hypothesized to be ascribed to interactions between the amino (–NH₂) and hydroxyl (–OH) groups in SS and the oxygen atoms in the ZrO2 NPs, which increases the electron density around the oxygen atoms30.
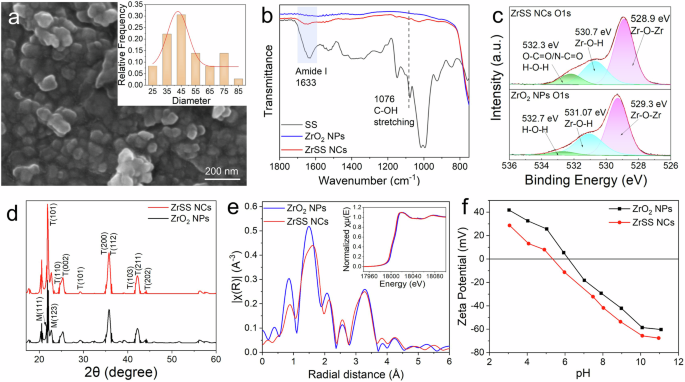
a Morphology of the ZrSS NCs and their size distribution (illustration); b ATR-FTIR, c XPS O1s, d XRD, e synchrotron-based Zr EXAFS R-space (normalized Zr K-edge XANES spectra in illustration) spectra, and f zeta potential of the ZrSS NCs and ZrO2 NPs.
The crystal structure of the ZrO2 NPs is mainly in the tetragonal phase (labeled with ‘T’ in Fig. 1d), with the presence of a monoclinic phase (labeled with ‘M’ in Fig. 1d)31,32. The ZrSS NCs keep the same crystal structure as the ZrO2 NPs. The incorporation of SS slightly widens the plane T(101). These results demonstrate that the crystal structure of ZrO2 was not altered during the SS modification process. X-ray absorption near edge structure (XANES) of Zr K-edge in the illustration of Fig. 1e shows that both the ZrO2 NPs and ZrSS NCs exhibit a narrow white line with a mild negative slope. These characteristics are a combination of the strong negative slope from the monoclinic phase and the double peak from the tetragonal phase, resulting in a broad single peak with a mild negative slope30,33. In addition, at the pre-edge (18,002.5 eV), there is a characteristic of the tetragonal phase, which is the 1s → 4d transition30. The XANES results also demonstrate that the structure of ZrO2 NPs is primarily in the tetragonal phase, with a small amount of the monoclinic phase present. Figure 1e shows the Fourier transforms of Zr extended X-ray absorption fine structure (EXAFS). The peaks at 1.47 Å and 1.56 Å correspond to the Zr–O shell in the ZrO2 NPs and ZrSS NCs, respectively. The peaks at 3.28 Å are Zr–Zr shell. This indicates that in ZrSS NCs, the first coordination shell around the Zr atoms is O and the second coordination shell is Zr, with the coordination number of O remaining unchanged compared to ZrO2 NPs. In other words, it can be speculated that the functional groups of SS do not form new bonds with Zr in the ZrSS NCs. However, compared to ZrO2 NPs, the Zr-O shell peak position of ZrSS NCs is slightly shifted and its intensity is reduced, which is supposed to be influenced by SS incorporation. In addition, the zeta potential results (Fig. 1f) show that ZrSS NCs exhibit a reduced positive potential and an enhanced negative potential in the whole pH range, compared to ZrO2 NPs.
Properties and performances of the ZrSS membranes
The ZrSS membrane was fabricated through the NIPS method by incorporating synthesized ZrSS NCs into the PAN casting solution. To confirm the successful integration of the ZrSS NCs into the PAN membrane, XPS and synchrotron-based technologies (i.e., VESPERS, HXMA, and MID-IR, Fig. S3) were employed to characterize the synthesized PAN and ZrSS membranes. The surface chemical properties of the ZrSS and PAN membranes were studied via XPS as illustrated in Fig. 2a, b. The high-resolution N 1s spectrum shows a primary peak at 398.7 eV, corresponding to the predominant nitrile group (–C≡N) in PAN, and a peak at 400.4 eV from the –NCH3 group due to residual DMF solvent in the membrane34. Compared to the PAN membrane, the N 1s spectrum of the ZrSS membrane shows two new peaks at 398.4 eV and 399.6 eV, corresponding to the –C–NH2 and O=C–N–C groups, respectively, which are predominant in SS35. Additionally, the –NCH3 group disappears in the N 1s spectrum of the ZrSS membrane, indicating no DMF residue. This suggests that the incorporation of ZrSS NCs accelerates the phase transfer rate, leading to a nearly complete exchange of DMF with water molecules during the membrane-forming process. In the high-resolution O 1s spectrum of the ZrSS membrane, peaks at 527 eV, 531.1 eV, 533.6 eV, and 535.8 eV correspond to O–Zr, N–C=O/O–C=O, C–O, and O–H groups, respectively 36. These XPS results confirm the successful fabrication of the ZrSS membrane. Importantly, compared to the O–Zr (528.9 eV), N–C=O/O–C=O (400.6 eV), and –C–NH2 (399.4 eV) groups in the ZrSS NCs (Figs. 1c and S4), the binding energy of these functional groups in the ZrSS membrane are red-shifted (527 eV, 399.6 eV, and 398.4 eV). This shift is speculated to be attributed to the hydrogen bonding between the nitrile groups in PAN and ZrSS NCs.
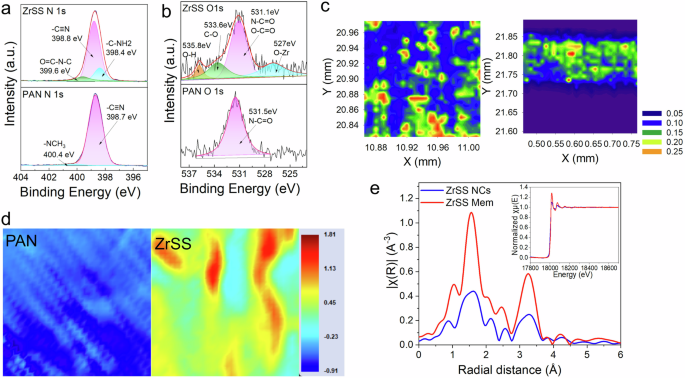
a, b High-resolution N 1s and O 1s spectra of the ZrSS and PAN membrane; c synchrotron-based XRF mappings of the Zr element distribution on the surface and cross-section of the ZrSS membrane; d synchrotron-based MID-IR mappings (200 µm × 200 µm) of the Amide I group distribution on the PAN and ZrSS membrane surface; e synchrotron-based R-space Zr EXAFS (normalized Zr K-edge XANES spectra in illustration) spectra of the ZrSS NCs and ZrSS membrane.
The high brightness and high resolution of the synchrotron-based light sources are highly sensitive to the elemental and chemical composition of materials, providing detailed information about the structure and properties of the sample. The synchrotron-based X-ray Fluorescence (XRF) mappings of the zirconium (Zr) element distributions within the cross-section and on the surface of the ZrSS membrane are shown in Fig. 2c. It can be observed that the Zr element is almost uniformly distributed on both the surface and the cross-section of the ZrSS membrane. In comparison, no Zr element was detected on the surface and cross-section of the PAN membrane (Fig. S5). The uniform distribution of the Zr element demonstrated that ZrSS NCs reduced the agglomeration of ZrO2 NPs in the membrane polymer matrix. Figure 2d shows the distribution of the Amide I functional group on the surfaces of the PAN and ZrSS membranes, measured using synchrotron-based MID-IR spectroscopy. It can be seen that the Amide I group is uniformly distributed only on the surface of the ZrSS membrane. The XRF and MID-IR mappings demonstrate that the incorporated ZrSS NCs are uniformly distributed throughout the membrane. To further verify whether new chemical bonds were formed between the ZrSS NCs and the PAN polymer, the membranes were characterized using synchrotron-based HXMA technology. The R-space spectrum of the Zr element is displayed in Fig. 2e, with the inset showing the k-space spectra. From these spectra, it can be inferred that no new chemical bond is formed between the ZrSS NCs and the PAN polymer in the ZrSS membrane.
To optimize the performance of the ZrSS membranes, the effects of incorporated ZrSS NC concentration (i.e., 0.1 wt%, 0.2 wt%, 0.3 wt%, and 0.5 wt%) were investigated and the membranes were labeled as 1ZrSS, 2ZrSS, 3ZrSS, and 5ZrSS, respectively. According to SEM (scanning electron microscope) images (Fig. S6), there is no significant difference in the surface morphologies between the ZrSS membranes and the PAN membrane. However, the cross-section structures reveal notable differences (Fig. S7). The cross-section of the PAN membrane shows no thin skin layer; instead, it consists of a porous support layer filled with macropores. Relative to the overall membrane thickness of 116 µm, the pore length is only 87 µm, with approximately 29 µm at the bottom of the membrane being non-porous. This non-porous region resulted from insufficient exchange between the solvent DMF and the non-solvent DI water during the membrane formation process. With the incorporation of ZrSS NCs, a thin skin layer filled with numerous mesopores appears at the top of the membrane. Moreover, the pores in the porous support layer of the ZrSS membranes nearly penetrate the entire membrane thickness, particularly in the 3ZrSS membrane, which exhibits no non-porous section at the membrane bottom (Fig. 3a). These structures help enhance both water flux and oil rejection. AFM (Atomic Force Microscope) results in Fig. 3b and S8 indicates that the surface roughness of the ZrSS membranes decreases compared to the PAN membrane. Particularly, the 3ZrSS membrane has the lowest surface roughness (Rq = 9.6 nm), which is advantageous for mitigating membrane fouling. The synchrotron-based XRF spectra (Fig. 3c) reveal that the Zr Kα peak is observed between 15,332 eV and 16,318 eV. The intensity of Zr increases as the incorporation amount of ZrSS NCs rises, indicating the successful preparation of the ZrSS membranes with varying concentrations. The zeta potential results of the ZrSS and PAN membranes are shown in Fig. S9. With the increasing addition of the ZrSS NCs, the zeta potential of the ZrSS membrane significantly decreases, because the ZrSS NCs exhibit a negative charge at pH > 5 (Fig. 1f). Additionally, the incorporation of ZrSS NCs improves the hydrophilicity of the membrane, as evidenced by the water contact angle (WCA) of the 3ZrSS membrane improving to 43˚ compared to 80˚ for the PAN membrane (Fig. 3d). This improved hydrophilicity led to a significant increase in the pure water flux of ZrSS membranes. Elaborately, compared to the PAN membrane, the 1ZrSS, 2ZrSS, 3ZrSS, and 5ZrSS membranes show 26.99%, 43.36%, 67.58%, and 61.81% increases in water flux, respectively (Fig. 3d). Performances of the ZrSS membranes for PW treatment were significantly enhanced (Fig. 3e). There are 9.05%, 10.71%, 11.04%, and 11.02% increases in oil rejection for 1ZrSS, 2ZrSS, 3ZrSS, and 5ZrSS membranes. These enhancements can be attributed to the formation of the thin skin layer on the top of the ZrSS membrane, the reduction in overall membrane thickness, the increase in pore length of the support layer, the enhancement of surface negative potential, and the improvement of hydrophilicity of the ZrSS membrane. The antifouling performance of membranes is represented through the normalized water flux J/J0, where J0 is the pure water flux (i.e., water flux during deionized water filtration) and J is the water flux during PW filtration. A higher value of J/J0 indicates a smaller water flux decrease and a better antifouling ability. All ZrSS membranes exhibit significantly improved antifouling performances compared to the PAN membrane (Fig. 3e). This improvement can be attributed to several factors (Fig. 4). Primarily, all ZrSS membranes have significantly stronger negative zeta potentials compared to the PAN membrane. Since the oil droplets are also negatively charged, the stronger negative charge of the ZrSS membrane results in a greater repulsive force for the oil droplets. Additionally, the improved hydrophilicity of the ZrSS membranes helps enhance their antifouling performance. Furthermore, the significantly reduced surface roughness of the ZrSS membranes also contributes to their improved antifouling capabilities. Considering the overall results, the 3ZrSS membrane demonstrates the best performance (i.e., highest water flux, oil rejection, and antifouling ability) among the four ZrSS membranes and is used for subsequent experiments. The stability of ZrSS NCs within the PAN polymeric matrix under different pH conditions was assessed. Results (Table S2) show that leached Zr at pH levels of 3, 5, 7, 9, and 11 were 2.7 µg/L, 9.8 µg/L, 14.1 µg/L, 14.4 µg/L, and 7.8 µg/L, respectively. Compared to the modification concentration, such trace-level leaching demonstrates the excellent stability and compatibility of the ZrSS NCs with the PAN polymeric matrix. This demonstrates that ZrSS NCs effectively overcome the challenges of poor compatibility of ZrO2 NPs with membrane-forming polymers and ZrO2 NPs leaching from the polymeric matrix37.

a, b SEM and AFM morphology of the 3ZrSS membrane; c synchrotron-based XRF Zr Kα spectra of the PAN and a variety of ZrSS membranes; d water contact angles (WCAs) and pure water flux of J0 the PAN and a variety of ZrSS membranes; and e oil rejection and antifouling capacity (normalized water flux J/J0) of the PAN and a variety of ZrSS membranes.
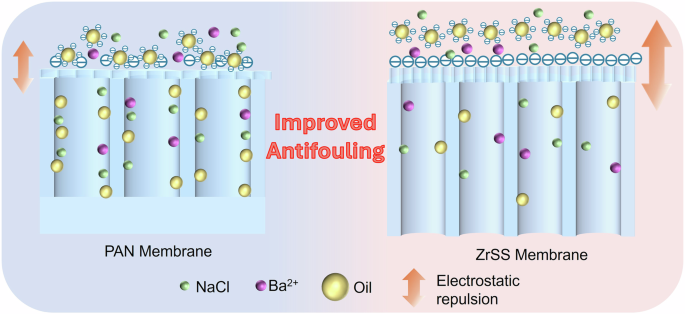
Schematic showing properties and antifouling mechanism of the PAN and ZrSS membranes. The quantities of NaCl, Ba2+, and oil droplets represent their concentrations, with higher quantities indicating higher concentrations. The size of the arrows represents the strength of the interactions, with larger arrows indicating stronger interactions.
Interaction effects of environmental factors on ZrSS membrane performances
There are many coexisting substances in the PW, such as salt ions, heavy metal ions, and organic pollutants1. In addition, the pH conditions may also vary due to different geological conditions38. The effects of these environmental factors on the membrane performance for PW treatment require systematic investigation. In this study, four common and representative environmental factors (i.e., pH level, salinity, heavy metal concentration, and PAH concentration) were selected to explore their individual and interactive effects on membrane performances for PW treatment. The upper and lower levels of these parameters were determined based on a literature review on pollutants present in PW1,38. These two review articles summarized the types and concentrations of substances present in PW from various locations. The maximum and minimum values of the four selected parameters were used as the upper and lower levels in this study. By evaluating the treatment performance of the ZrSS membrane for PW across a broader range of conditions, its practical applicability can be more effectively verified. This is particularly important for assessing its adaptability in extreme environments. The experimental design was conducted using a full 2k factorial analysis, resulting in a total of 16 experimental groups (Table S3)15,25. Fig. 5a presents the results of the normalized water flux (J/J0) for these 16 groups of experiments. The normalized water flux can effectively illustrate the variations in water flux during membrane filtration of oil/water emulsions. Additionally, it can further reflect the extent of the membrane fouled by oil droplets and the antifouling performance of the membrane10,16. As shown in Fig. 5b, environmental factors have a minor effect on oil rejection, which is not very significant. However, the water flux is significantly impacted under different environmental conditions. Specifically, the highest J/J0 value is observed in group No. 6, followed by group No. 10. Groups Nos. 8 and 16 have nearly identical values, which are slightly lower than that of group No. 10, followed by groups Nos. 4 and 12. The other groups show differences, but none are as significantly higher than these mentioned groups. Figure 5c shows the main effects of these four environmental conditions on J/J0. Results show that three factors (i.e., pH level, Ba2+ concentration, and NaCl concentration) significantly affect water flux, with pH showing the greatest impact. In detail, under the low pH level (pH = 3.2, acidic condition), the water flux of the 3ZrSS membrane remarkably decreases (J/J0 = 0.24), while under the high pH level (pH = 11.8, alkaline condition), it only slightly decreases (J/J0 = 0.48). Under the low Ba2+ (0.3 mg/L) concentration, the 3ZrSS membrane shows relatively high water flux (J/J0 = 0.45), whereas the water flux is significantly reduced under the high Ba2+ (342 mg/L) concentration (J/J0 = 0.28). In terms of NaCl concentration, under the low NaCl concentration (18 mg/L), the water flux of the 3ZrSS membrane significantly reduces (J/J0 = 0.42), whereas this reduction is alleviated under high NaCl concentration (70,000 mg/L) (J/J0 = 0.30). Naphthalene was selected as the PAH representative in this study. Although the presence of PAH accelerates the decline in water flux and exacerbates membrane fouling, the effect is not pronounced. Among these four factors, only NaCl concentration has a significant impact on oil rejection (Fig. 5d). High NaCl concentration decreases the rejection of oil droplets, decreasing it from 99.99% at low NaCl concentration to 96.92%.
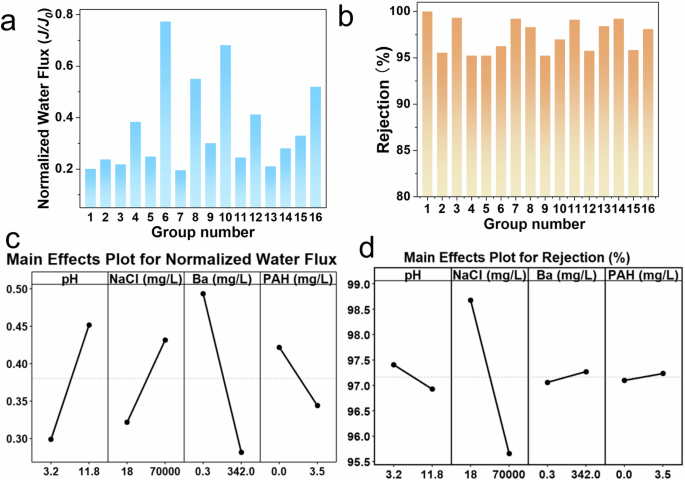
a Normalized water flux (J/J0) and b oil rejection of the 3ZrSS membrane for PW treatment under 16 groups of environmental conditions; main effects of four environmental factors (pH, salinity, heavy metal, and PAHs) on the normalized water flux (J/J0) (c) and oil rejection (d).
In addition to the main effects of the individual factors, there are also interactive effects between factors on water flux and oil rejection. As shown in Fig. 6a, notable interactions between pH level and Ba2+ concentration, pH level and PAH concentration, pH level and NaCl concentration, as well as NaCl concentration and Ba2+ concentration are observed. Specifically, at the pH of 11.8, an increase in Ba2+ concentration results in a significant decrease in water flux, with J/J0 dropping from 0.63 to 0.33. In contrast, at a pH of 3.2, the water flux remains consistently low, with J/J0 values of 0.22 and 0.26 at high and low Ba2+ concentrations. In other words, at low Ba2+ concentration, the decrease in water flux is significantly less at the alkaline pH (J/J0 = 0.63) compared to the acidic pH condition (J/J0 = 0.26). However, at high Ba2+ concentrations, water flux decreases significantly regardless of pH values. At the high pH level, the decrease in water flux is significantly greater at the low NaCl concentration (J/J0 = 0.56) compared to the high NaCl concentration (J/J0 = 0.40). Conversely, at low pH levels, this effect weakens, with J/J0 at 0.21 for low NaCl and 0.28 for high NaCl concentration. Similarly, at high NaCl concentration, the decrease in water flux is much less in the alkaline pH environment (J/J0 = 0.56) than in the acidic pH environment (J/J0 = 0.28). At a low NaCl concentration, the effect of pH is reduced. The interaction between pH level and PAH concentration is quite interesting. At the alkaline pH level, the addition of PAH slightly worsens membrane fouling, with J/J0 decreasing from 0.50 to 0.46. Conversely, at an acidic pH level, adding PAH slightly alleviates membrane fouling, with J/J0 increasing from 0.23 to 0.25. At the high NaCl concentration, the normalized water flux (J/J0) is 0.52 for the low Ba2+ concentration and 0.32 for the high Ba2+ concentration. At the low NaCl concentration, J/J0 is 0.37 and 0.23 for low and high Ba2+ concentration.

Interactive effects of the four environmental factors on normalized water flux (J/J0) (a) and oil rejection (b).
Figure 6b depicts the interactive effects of oil rejection. There are weak interactions between pH level and NaCl concentration, pH level and Ba2+ concentration, NaCl concentration and Ba2+ concentration, as well as Ba2+ concentration and PAH concentration, affecting oil rejection. Elaborately, at the low NaCl concentration, the oil rejection is higher in an acidic pH environment (99.34%) compared to the alkaline pH environment (98.00%). Similarly, at the low NaCl concentration, the high PAH concentration slightly decreases the oil rejection from 97.50% (low PAH concentration) to 96.69%. At the low Ba2+ concentration, the oil rejection is higher in the acidic pH environment (97.60%) compared to the alkaline pH environment (96.51%). At the low Ba2+ concentration, the PAH concentration has little impact on the oil rejection, with 96.76% and 97.36% at low and high PAH concentrations.
Membrane fouling model and XDLVO theory for mechanism analysisMembrane fouling model
Hermia model has been widely applied for the analytical description of all four blocking mechanisms (complete pore blocking, intermediate pore blocking, standard pore blocking, and cake layer formation) and/or a combination of them for the ultrafiltration process39,40. Simulation results of the 3ZrSS membrane operated under various environmental conditions are described in Fig. 7. The fitting quality of the model is evaluated using the RMSE (root mean square error) value (Table S4). The dominant fouling mechanism for Nos. 6, 8, 10, and 16 groups is intermediate blocking (Ki fitting), where continuous gradual adsorption significantly influences membrane fouling. Their water fluxes gradually decline and keep a high and stable water flux. The standard blocking fouling model (Ks fitting) shows the best fitting degree for the No. 12 group. Compared to the intermediate blocking, the initial water flux decline rate is faster in the standard blocking mode, due to the rapid adsorption. Their initial water flux decline and steady water flux are both significantly lower than those of the previous four groups. The water flux decline in the No. 4 group is initially caused by standard blocking, followed by cake layer formation (Kgl fitting), which begins around 100 min. Its initial water flux decline trend is similar to that of the No. 12 group but with a faster decline rate. After the formation of the cake layer, the water flux decline rate slows down, and the steady water flux is lower than that of the No. 12 group. Similarly, the flux declines in the Nos. 2, 5, 9, 11, 14, and 15 groups are also initially caused by standard blocking, followed by the formation of a cake layer. The times at which the cake layer forms are 40, 40, 60, 50, 40, and 40 min, respectively. Their water fluxes decline rapidly at the beginning of the filtration process and then slow down after the formation of the cake layer. Although they follow the same fouling model, their water flux decline rates are also influenced by the specific environmental conditions. This will be further explained in detail in the subsequent XDLVO analysis. The Nos. 1, 3, 7, and 13 groups experience a rapid decline in water flux to a relatively low level within the first 10–20 min due to complete blocking (Kc fitting), where the membrane pores are completely blocked via foulants, causing the water flux to drop sharply. Subsequently, a cake layer forms, and the water flux remains nearly stable at a low level.
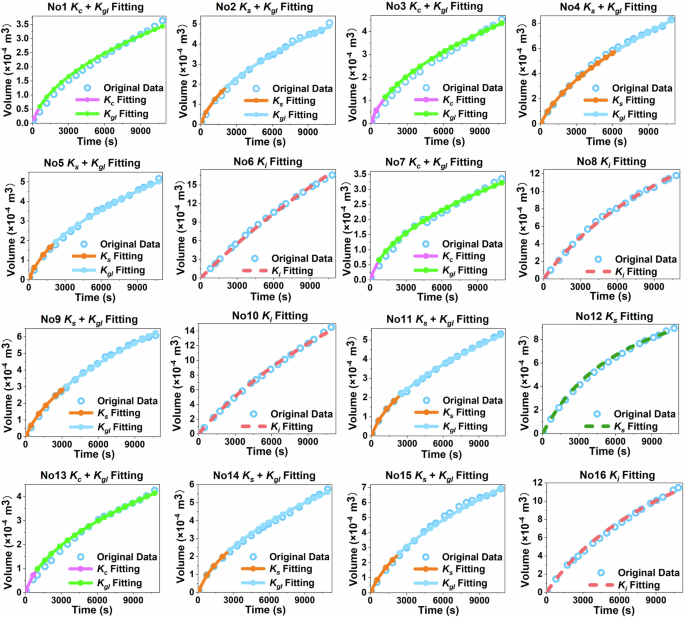
Filtration volume and time data and fitting curve of the 3ZrSS membrane under 16 different environmental conditions. Kc is the complete blocking model constant, Ks is the constant of standard blocking, Ki is the constant of intermediate blocking, and Kgl is the constant of cake filtration.
Interaction energy analysis
As the foulants approach the membrane, interfacial forces become the dominant factor in their interaction41. The XDLVO theory evaluates the surface interaction energy between the membrane and foulants by incorporating zeta potential and contact angle measurements. This approach allows for a deeper analysis of fouling behavior by considering key interfacial forces, including van der Waals (ULW), Lewis acid–base (UAB), and electrostatic double-layer (UEL) interface interaction energies42. It can be used to describe these interfacial interaction energies between colloidal particles and the membrane surface as a function of their separation distance (d). Therefore, the interfacial interactions of the membrane–foulants (M–F) and foulants–foulants (F–F), were analyzed using XDLVO theory to better elucidate the membrane fouling process (Figs. 8 and S10 and 11). The schematic diagram of the interaction mechanism between the 3ZrSS membrane and foulants in PW is shown in Fig. 9. In particular, a positive value means repulsive force, while a negative value denotes an attractive interaction. The peak value of the total interaction energy (UTOT), known as the “energy barrier”, represents the amount of energy foulants must overcome to adhere to the membrane surface41.

Interfacial interaction energies between the 3ZrSS membrane and foulants (M–F) under 16 different environmental conditions.
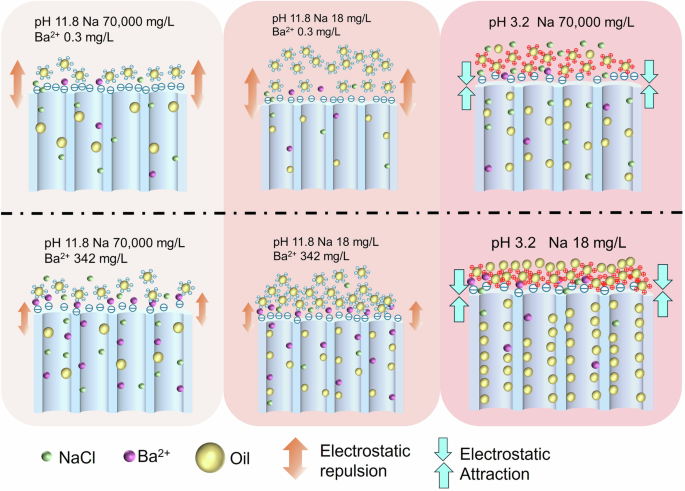
The quantities of NaCl, Ba2+, and oil droplets represent their concentrations, with higher quantities indicating higher concentrations. The size of the arrows represents the strength of the interactions, with larger arrows indicating stronger interactions.
Figure 8 shows that in all 16 experimental groups, the LW (van der Waals) and AB (Lewis acid–base) interactions of the M–F are attractive forces. However, the values of EL (electrostatic double-layer) interactions vary under different environmental conditions. The total interfacial interaction energy (TOT) is primarily influenced by EL interactions. Figure S11 displays the contrast of the UTOT of M–F and F–F, providing a clearer depiction of the tendency of oil droplets to approach the membrane or interact more with surrounding molecules. This allows for a better explanation of the fouling mechanism of the 3ZrSS membrane.
In detail, the energy barriers of M–F are 2647.7 KT and 2919.5 KT for the Nos. 6 and 10 groups, respectively. Their energy barriers of F–F are 1405.7 KT and 1687.6 KT. The UTOT(M–F) is significantly greater than UTOT(F–F) in both groups, indicating that the repulsive force between the membrane and oil droplets is considerably stronger than the intermolecular repulsion among oil droplets. As a result, the membrane exhibits a higher oil droplet rejection and low membrane fouling. The difference value of the energy barrier between the UTOT(M–F) and UTOT(F–F) is greater for No. 6 (1242 KT) than for No. 10 (1231 KT). Therefore, the flux decline in No. 6 is slower than in the No. 10 group. In these two groups, the strong repulsion UTOT(M–F) is dominated by repulsive EL, which is generated by the combination of high pH level and low Ba2+ concentration. Additionally, the high NaCl concentration reduces the oil/water emulsion concentration, resulting in consistently high water flux, indicating low membrane fouling. Under such conditions, the PW can be directly filtered through the 3ZrSS membrane without pretreatment. The Nos. 8 and 16 groups exhibit a trend similar to that of the Nos. 6 and 10 groups. A little bit of severe membrane fouling occurs in the Nos. 8 and 16 groups due to their low NaCl concentration, which leads to a high oil concentration. However, both UTOT(M–F) and UTOT(F–F) exhibit repulsive interactions, with UTOT(M–F) being greater than UTOT(F–F). As a result, the 3ZrSS membrane still shows a relatively low flux decline. Therefore, PW with a high pH level, low NaCl concentration, and low Ba2+ concentration can also be directly filtered through the 3ZrSS membrane without pretreatment.
In the No. 12 group, UTOT(M–F) equals UTOT(F–F) at d = 5.5 nm. When d TOT(M–F) repulsion becomes less than UTOT(F–F). As d further decreases, UTOT(M–F) repulsion changes to UTOT(M–F) attraction, which is larger than the UTOT(F–F) attraction, leading to an increased water flux decline rate. This is primarily due to the weak negative zeta potential of the oil droplets, caused by the charge shielding effect of high Ba2+ concentration. The water flux of group No. 4 further decreases compared to group No. 12. The EL repulsion in group No. 4 further decreases, resulting in a reduction of the UTOT(M–F). This suggests that PAHs may also slightly reduce the zeta potential of oil droplets. Additionally, when d = 7.4 nm, UTOT (F–F) equals UTOT (M–F). Compared to group No. 12, these increased d values indicate enhanced fouling in group No. 443. These suggest that pretreatment can be used to remove Ba2+ (e.g., precipitation) before 3ZrSS membrane filtration when PW has high pH, high NaCl concentration, and high Ba2+ concentration.
In the interactions between the 3ZrSS membrane and foulants in groups Nos. 9 and 15, the LW, AB, and EL interactions are consistently attractive, leading to an attractive UTOT (M–F). This implies that membrane fouling will be further exacerbated by foulants. The attractive UTOT (M–F) is attributed to the pH of 3.2 of both groups, resulting in positively charged oil droplets being strongly attracted to the negatively charged membrane surface. During the initial filtration stage, contaminants rapidly penetrate 3ZrSS membrane pores and adsorb onto the inner walls, causing a sharp decline in water flux. When the cake layer forms, the dominant force shifts to F–F interactions. The larger energy barrier and smaller d in No. 15 indicate stronger repulsive forces compared to No. 9, reducing oil droplet accumulation on the 3ZrSS membrane. As a result, the water flux declines more slowly after the cake layer forms. This is supported by Fig. S12, where the water flux in No. 15 gradually surpasses that of No. 9 after the cake layer forms at 40 min. Results of Nos. 9 and 15 indicate that the pH of PW can be adjusted to an alkaline level before filtration through the 3ZrSS membrane.
The initial UTOT(M–F) is greater than UTOT(F–F) Nos. 11 and 14, resulting in a slow decline in water flux. However, after 10 min, the water flux in groups Nos. 11 and 14 falls below that of Nos. 9 and 15. This can be attributed to the substantial amount of Ba2+ in these groups leading to its preferential adsorption onto the negatively charged membrane surface and within the pores. This adsorption shields some of the negative charges on the 3ZrSS membrane surface, thereby reducing the repulsive force against the oil droplets. Therefore, this further confirms the conclusion that at alkaline pH and high Ba2+ concentrations, Ba2+ should be removed before filtration with the 3ZrSS membrane.
In the M–F interactions for Nos. 2 and 5, the LW, AB, EL, and UTOT(M–F) are all attractive. Consequently, the water flux shows a rapid decline. The attractive EL forces are due to the positively charged zeta potentials of the oil droplets at pH 3.2, which are attracted to the negatively charged membrane surface. Compared to Nos. 9 and 15 (UTOT(M–F) is also attractive), the water flux declines more rapidly in Nos. 2 and 5 due to the high Ba2+ concentration in these groups. These small Ba2+ ions adsorb on the membrane pores and surface more easily than oil droplets, exacerbating membrane fouling. This suggests that regardless of the pH conditions and salinity of a PW, removing high concentration Ba2+ first before filtration through the 3ZrSS membrane can significantly reduce membrane fouling.
The interaction energies between the M–F in groups Nos. 1, 3, 7, and 13 are all attractive and similar in magnitude. Additionally, the repulsive forces between the oil droplets in these groups are also comparable. As a result, the flux decline process and the stable water flux are nearly identical for all four groups. The oil droplets in all four groups are positively charged, leading to attraction with the negatively charged membrane. The nearly similar zeta potentials across these groups indicate that the zeta potential is primarily influenced by pH, with minimal impacts from Ba2+, NaCl, and PAH under low pH conditions. This further indicates that adjusting the pH of PW to alkaline before 3ZrSS membrane treatment is advisable.
Long-term stability evaluation
To evaluate the long-term stability of the 3ZrSS membrane, a repeated cycle filtration and a 72 h long-term filtration test were conducted using synthesized produced water. Figure 10a shows the normalized water flux (J/J0) of the PAN and 3ZrSS membrane in four repeated cycle filtration tests. As shown in the figure, the water flux decline of the 3ZrSS membrane is significantly reduced in each filtration cycle, compared to the PAN membrane. Additionally, after DI backwashing, the water flux of the 3ZrSS membrane nearly returns to its initial value (J0) after each cycle, while the backwashing effect on the PAN membrane is much less pronounced. With increasing cycle numbers, the water flux of the PAN membrane gradually decreases even after backwashing. As shown in Fig. 10b, the FIR (flux irreversible decline rate) of the 3ZrSS membrane remains at a very low level of only 1.17% even after four PW fouling cycles. Meanwhile, its minimum FRR (flux recovery rate) reaches 98.83%. These indicate that the 3ZrSS membrane possesses excellent antifouling performance, as surface foulants can be easily removed by simple deionized water backwashing.
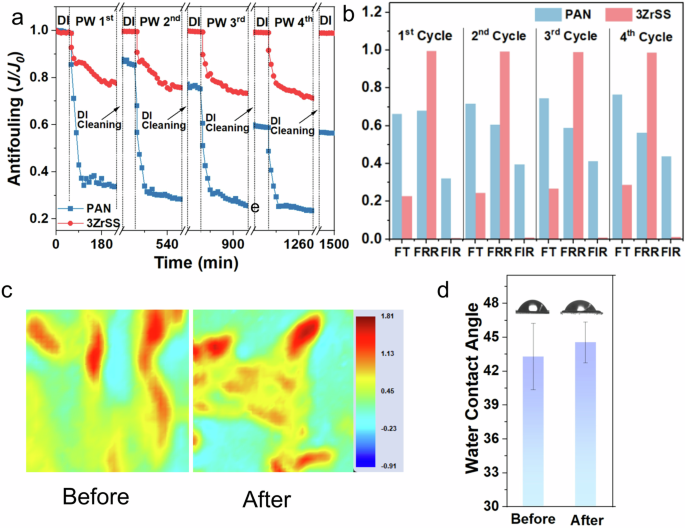
a Normalized water flux of membranes in four repeated cycle filtration tests; b total flux decline rate (FT), flux recovery rate (FRR), and flux irreversible decline rate (FIR) of membranes in four repeated cycle filtration tests; c synchrotron-based MID-IR mappings (200 µm × 200 µm) of the Amide I group distribution on the 3ZrSS membrane surface before and after four repeated cycle filtration test; and d water contact angles (WCAs) of the 3ZrSS membrane surface before and after four repeated cycle filtration test.
Additionally, the membrane properties were evaluated after four fouling cycles to determine whether these properties remained unchanged after prolonged cyclic filtration. As shown in Fig. 10c, the synchrotron-based MID-IR mappings show that the Amide I group was uniformly distributed on the surface of the 3ZrSS membrane after four fouling cycles, with consistent concentration levels as the original value. This indicates that the ZrSS nanocomposites remained stably in the 3ZrSS membrane without leaching after prolonged cyclic filtration. Furthermore, Fig. 10d shows that the water contact angle of the 3ZrSS membrane remained almost unchanged after filtration. These results collectively demonstrate that the 3ZrSS membrane maintained stable properties even after prolonged fouling cycles. Additionally, the oil rejection and antifouling performance of the 3ZrSS membrane were compared with recently reported membranes. Results in Fig. S14 and Table S8 show that the flux recovery rate of the 3ZrSS membrane is higher than most reported membranes, while also maintaining a high level of oil droplet rejection.
To further evaluate the long-term operational stability of the membranes, a 72-h continuous filtration test was conducted. As shown in Fig. 11a, the water fluxes of both the PAN and 3ZrSS membranes continuously decrease during filtration. For the PAN membrane, the most significant water flux decline occurred within the first hour, dropping rapidly to 37.06% of its initial water flux, followed by a slower decline. By the end of the filtration test, the water flux decreased to only 14.91% of its initial value. Similarly, the 3ZrSS membrane also experienced a relatively fast water flux decline during the first hour, but the reduction was much less severe, with the water flux maintaining 84.84% of its initial value after the first hour. Even after 72 h of filtration, the water flux of the 3ZrSS membrane still remained at 54.09% of its initial value, further validating its superior antifouling performance. As shown in Fig. 11b, the oil droplet rejections of the membranes increase with filtration time. The 3ZrSS membrane kept a high oil droplet rejection of over 99% during the filtration. The rejection of the PAN membrane increased more rapidly, rising from an initial value of 89.88% to 99.99% by the end of the filtration process. This is primarily attributed to the cake layer formed via accumulated foulants on the PAN membrane surface.
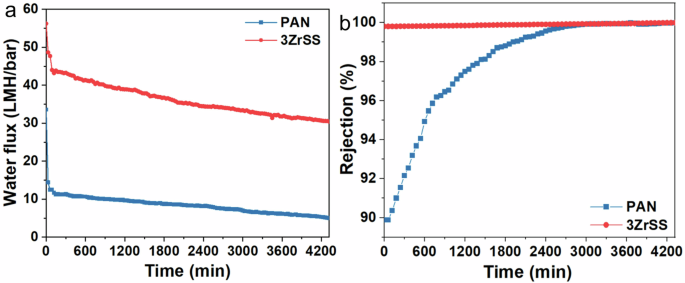
a Water fluxes and b oil rejection of membranes for a long-time (72 h) filtration test.