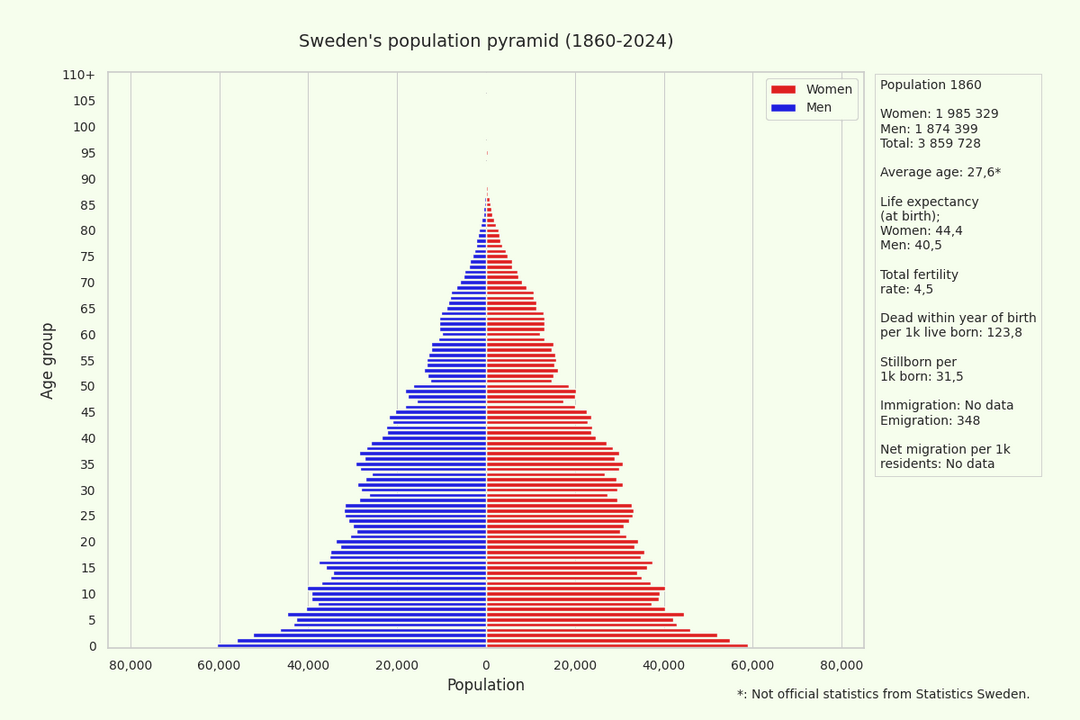

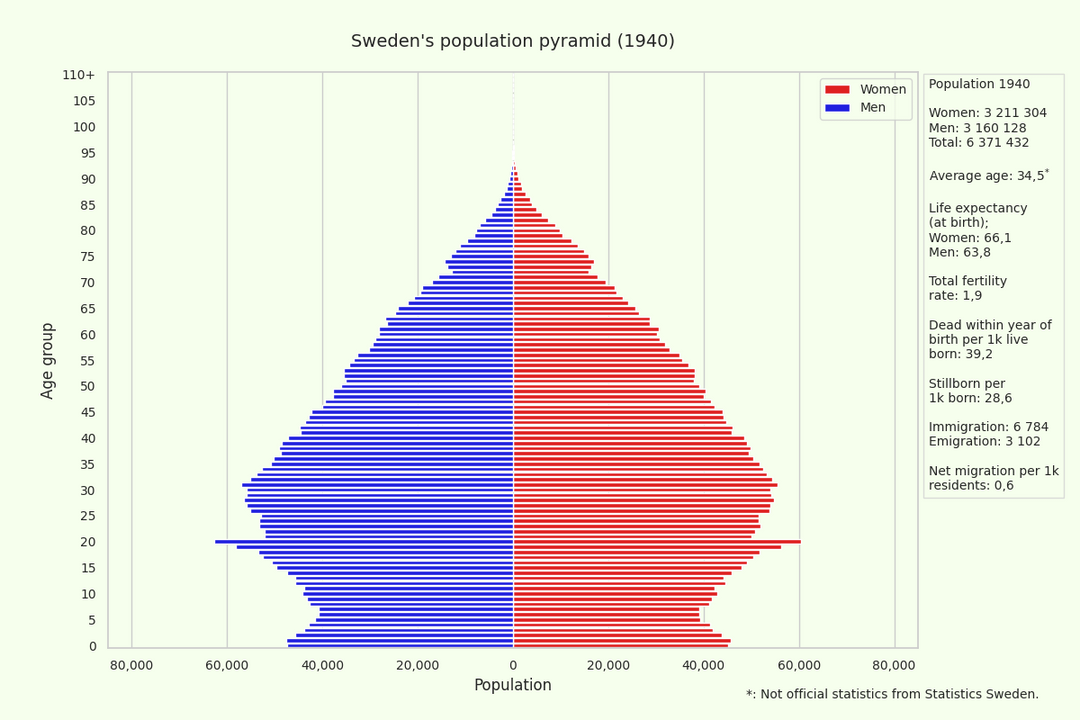
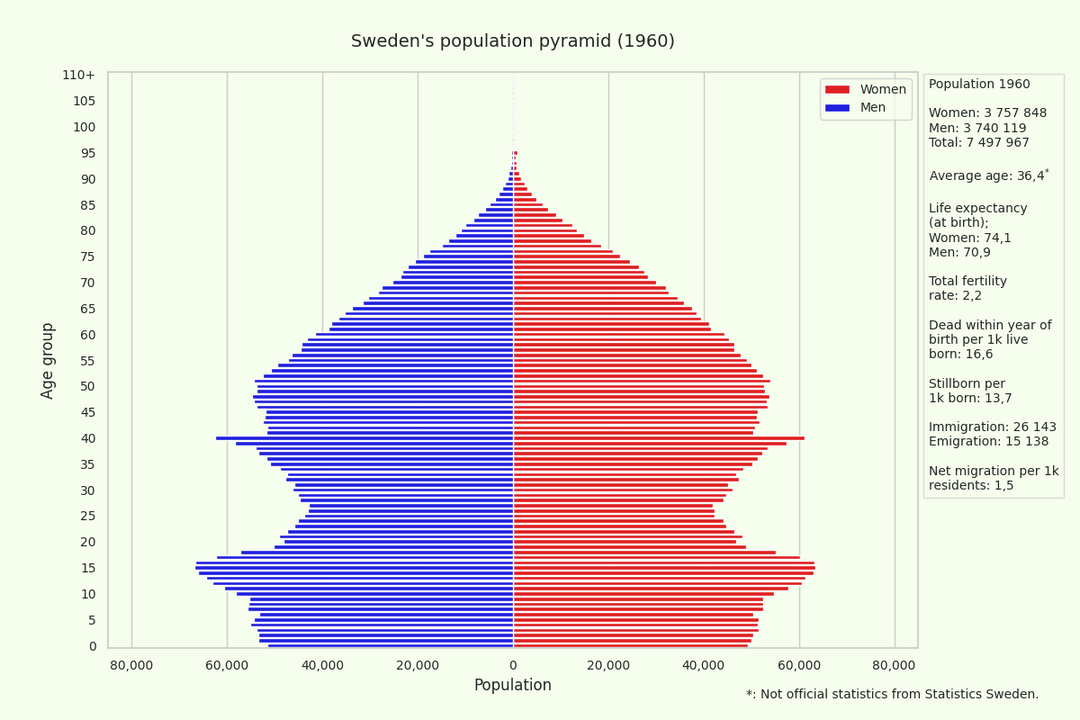
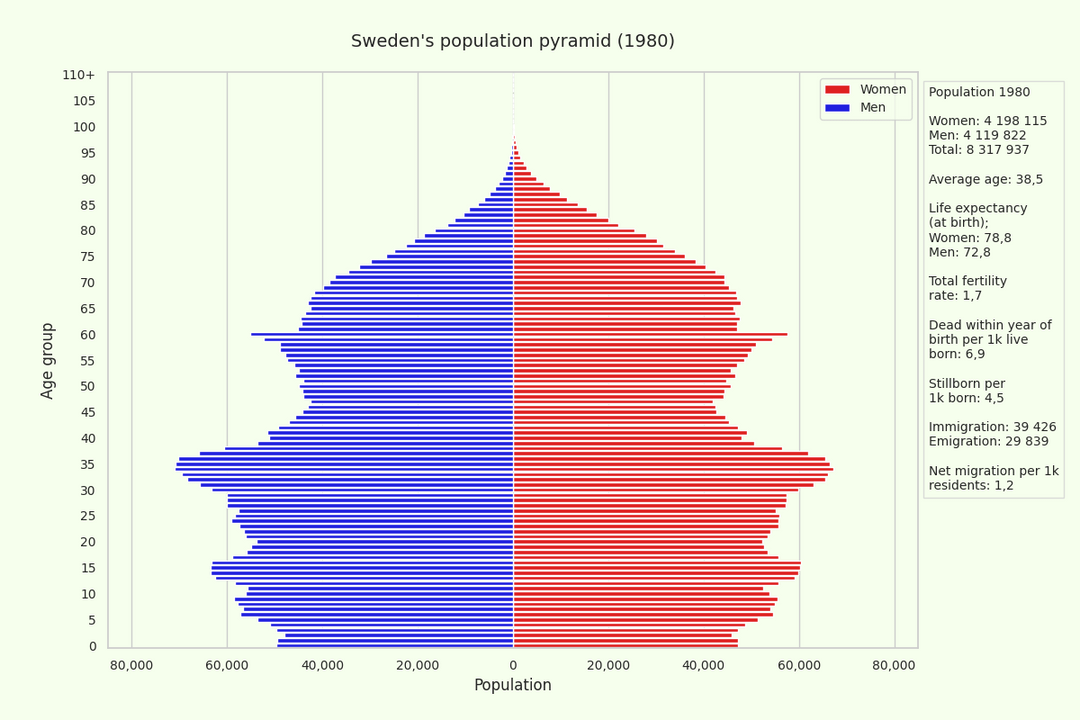
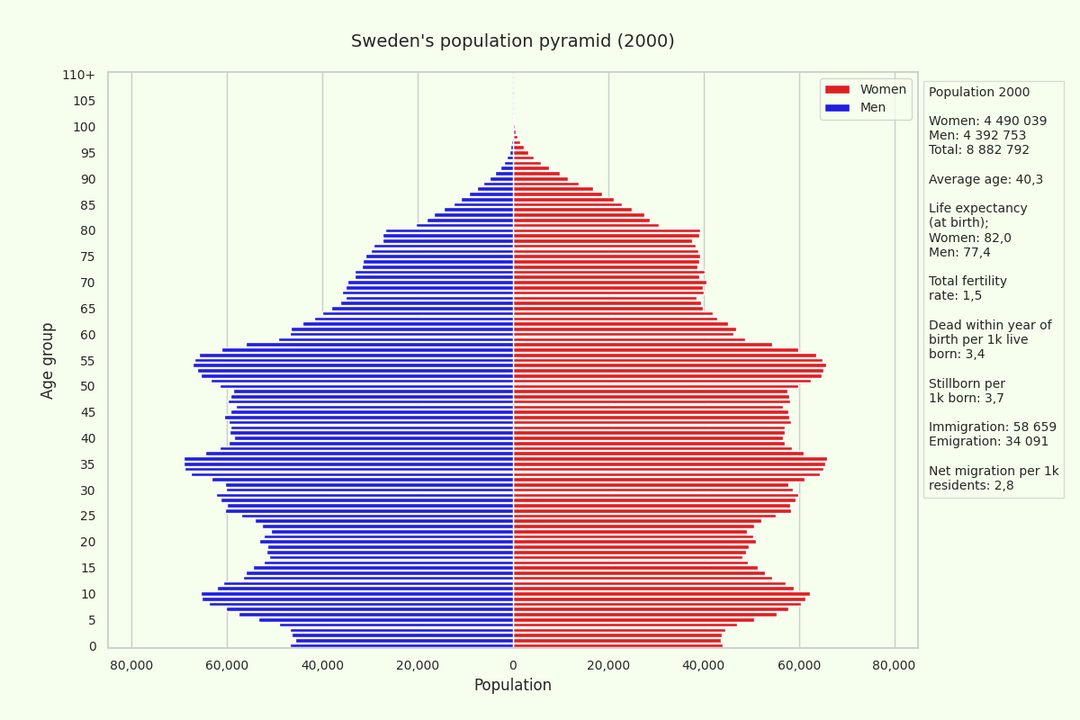
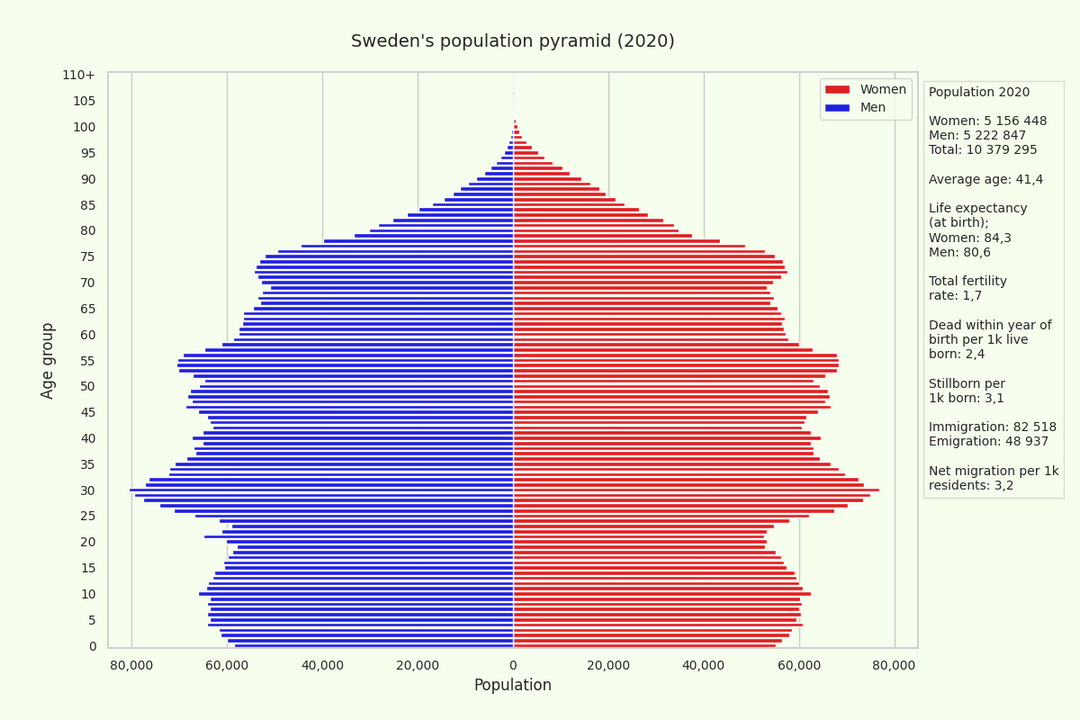
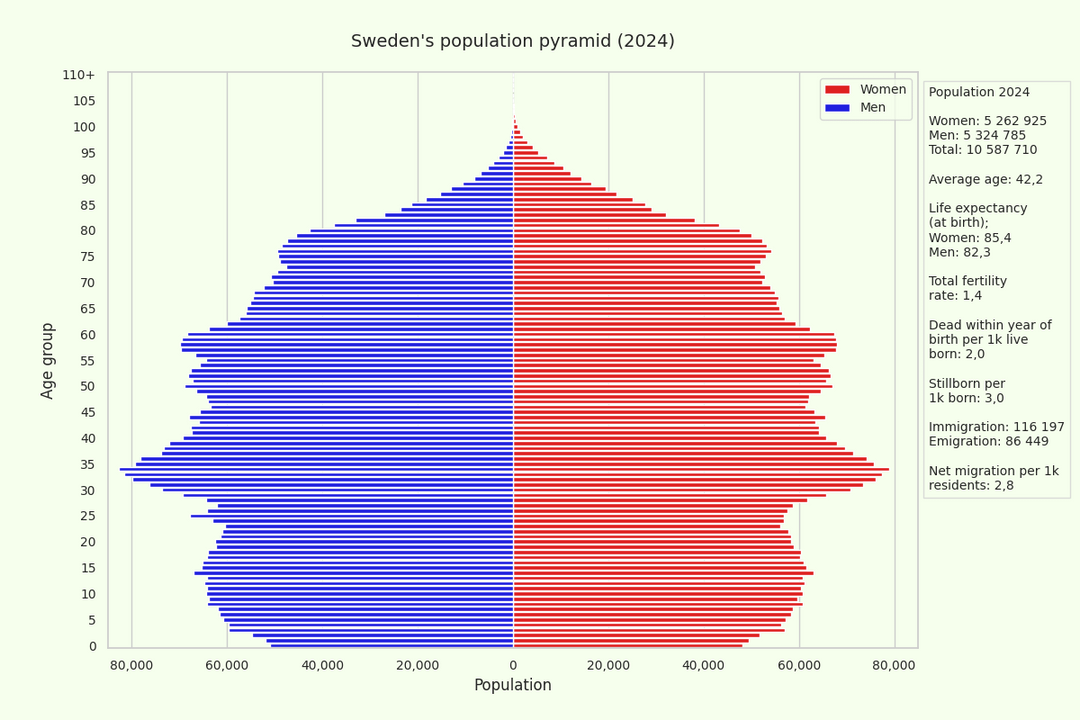
GIF showing the changing population pyramid of Sweden from 1860 to 2024. Some extra stats is included.
Also included some stills for a selection of years as the GIF takes three minutes to run.
Source for most of the data: Statistics Sweden (https://www.scb.se/en/)
Exceptions are 'Average age' up to and including 1967 which is calculated by me given the age groups of the given year, 'Net migration per 1k residents' which isn't official statistics but is calculated by me using other official data (((immigration-emigration)/population) * 1000) and the historical events mentioned.
Data for 'Life expectancy' and 'Total fertility rate' is not annual for the earlier years. They are given for five or ten years periods. From 1980 all data is annual.
Tools used: Python and some AI, mostly Claude
Posted by Moulin_Noir
11 comments
Is it wrong to say the experiment for infinite growth is about to be over?
Sweden or other Nordic countries arguably is the best place to live and raise children’s in with all the subsidies and support in a first world country.
However, the population is not even close to replacement level from natural birth.
If Sweden can’t make it, no chance a country like South Korea will make it.
That‘s pretty much every european country
Three distinct baby booms.
What happened in 1865-1870 ish? There is a noticeable dip there. I can guess at the historic context for the other changes after 1900 ish, but that escapes me.
Any Swedes have theories?
Here is a link to a [youtube video of the animation](https://www.youtube.com/watch?v=E59xtRvlQlg) for people who want to pause at a certain year.
How did this thread end up with a bunch of replacement theory nonsense?
Sheesh, went from more than 1 in 10 dying within 1 year to 5 per 1000.
Amazing that the scale of the x-axis doesn’t change!
Do you have any data with regards to the TFR of immigrants versus native Swedish?
How did the New York blackout baby boom affect Sweden…? /s
And 2000 male spike is mildly interesting.
1980-2000 elder male decline might be from long term world wars effects?
Can you make some plots of the additional data on the right vs time?
Birth rate, life expectancy, etc
I would also love to see the births per year in terms of absolute numbers over time.
Comments are closed.