![[OC] - Built a Cost of Living Calculator That Compares Living Costs Across US Regions](https://www.europesays.com/wp-content/uploads/2025/04/fyc0i40y0bte1-659x1024.png)
I wanted to build something that would be simple and easy to understand for people to see the effects tariffs have on their everyday purchases; so I built The Cost Index – Cost of Living, a live website that shows which countries export what to the U.S. and how that could affect prices at the grocery store.
You can pick a product, and it will estimate price shifts based on live data + tariff rates.
It also tracks retaliatory tariffs from countries like China, India, Brazil, etc., so you can see how these trade moves might affect prices.
All data is pulled from FRED, and public trade sources. Not monetized. Just trying to make economic policy feel a little more real.
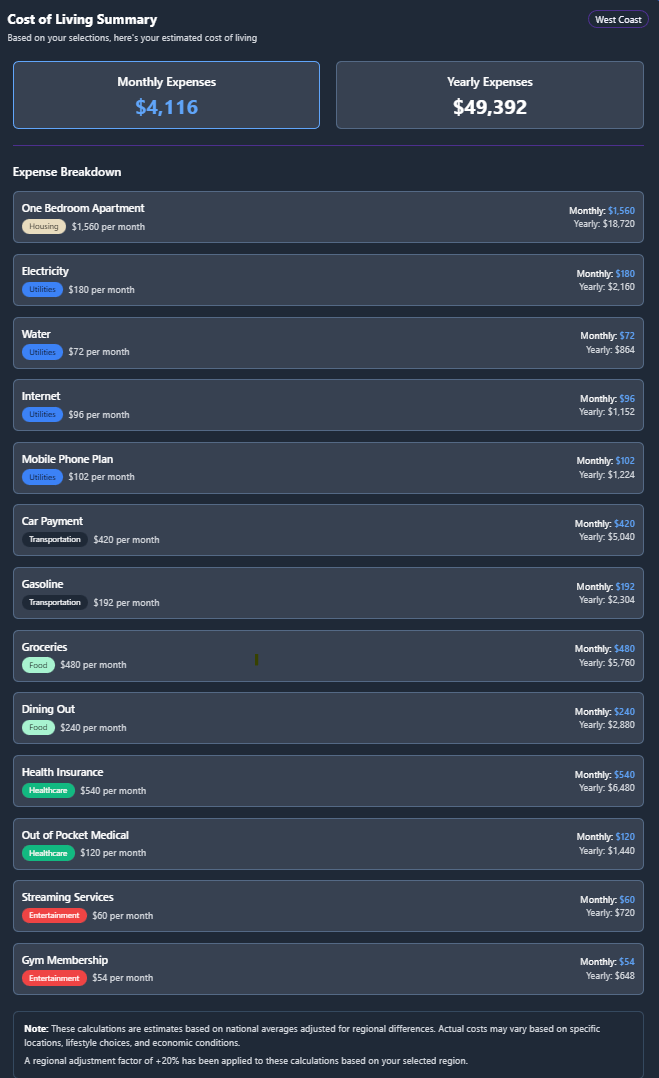
Since the tariff calculator was not as beautiful as the cost of living page (its being worked on i swear); i included an image of the cost of living page that shows how much you would pay per month depending on the area you live in the US. Other countries to follow!
Curious to know what you think and what you would want added into this!
Posted by xenon7-7
3 comments
Do you record user input? If so, could you do a heatmap of COL with a gradient color scheme? Maybe by county if possible.
I must be poor cause I’m looking at everything besides rent and groceries and thinking these are insane rates. 100 per month for a phone plan huh??
This looks like you just have percentage differences from the median for the country and then you scale every item by that difference. That isn’t how cost of living differences work – they vary by item. If one region is 10% cheaper than another, that doesn’t mean that groceries, rent, transportation, etc are all 10% cheaper.
Comments are closed.