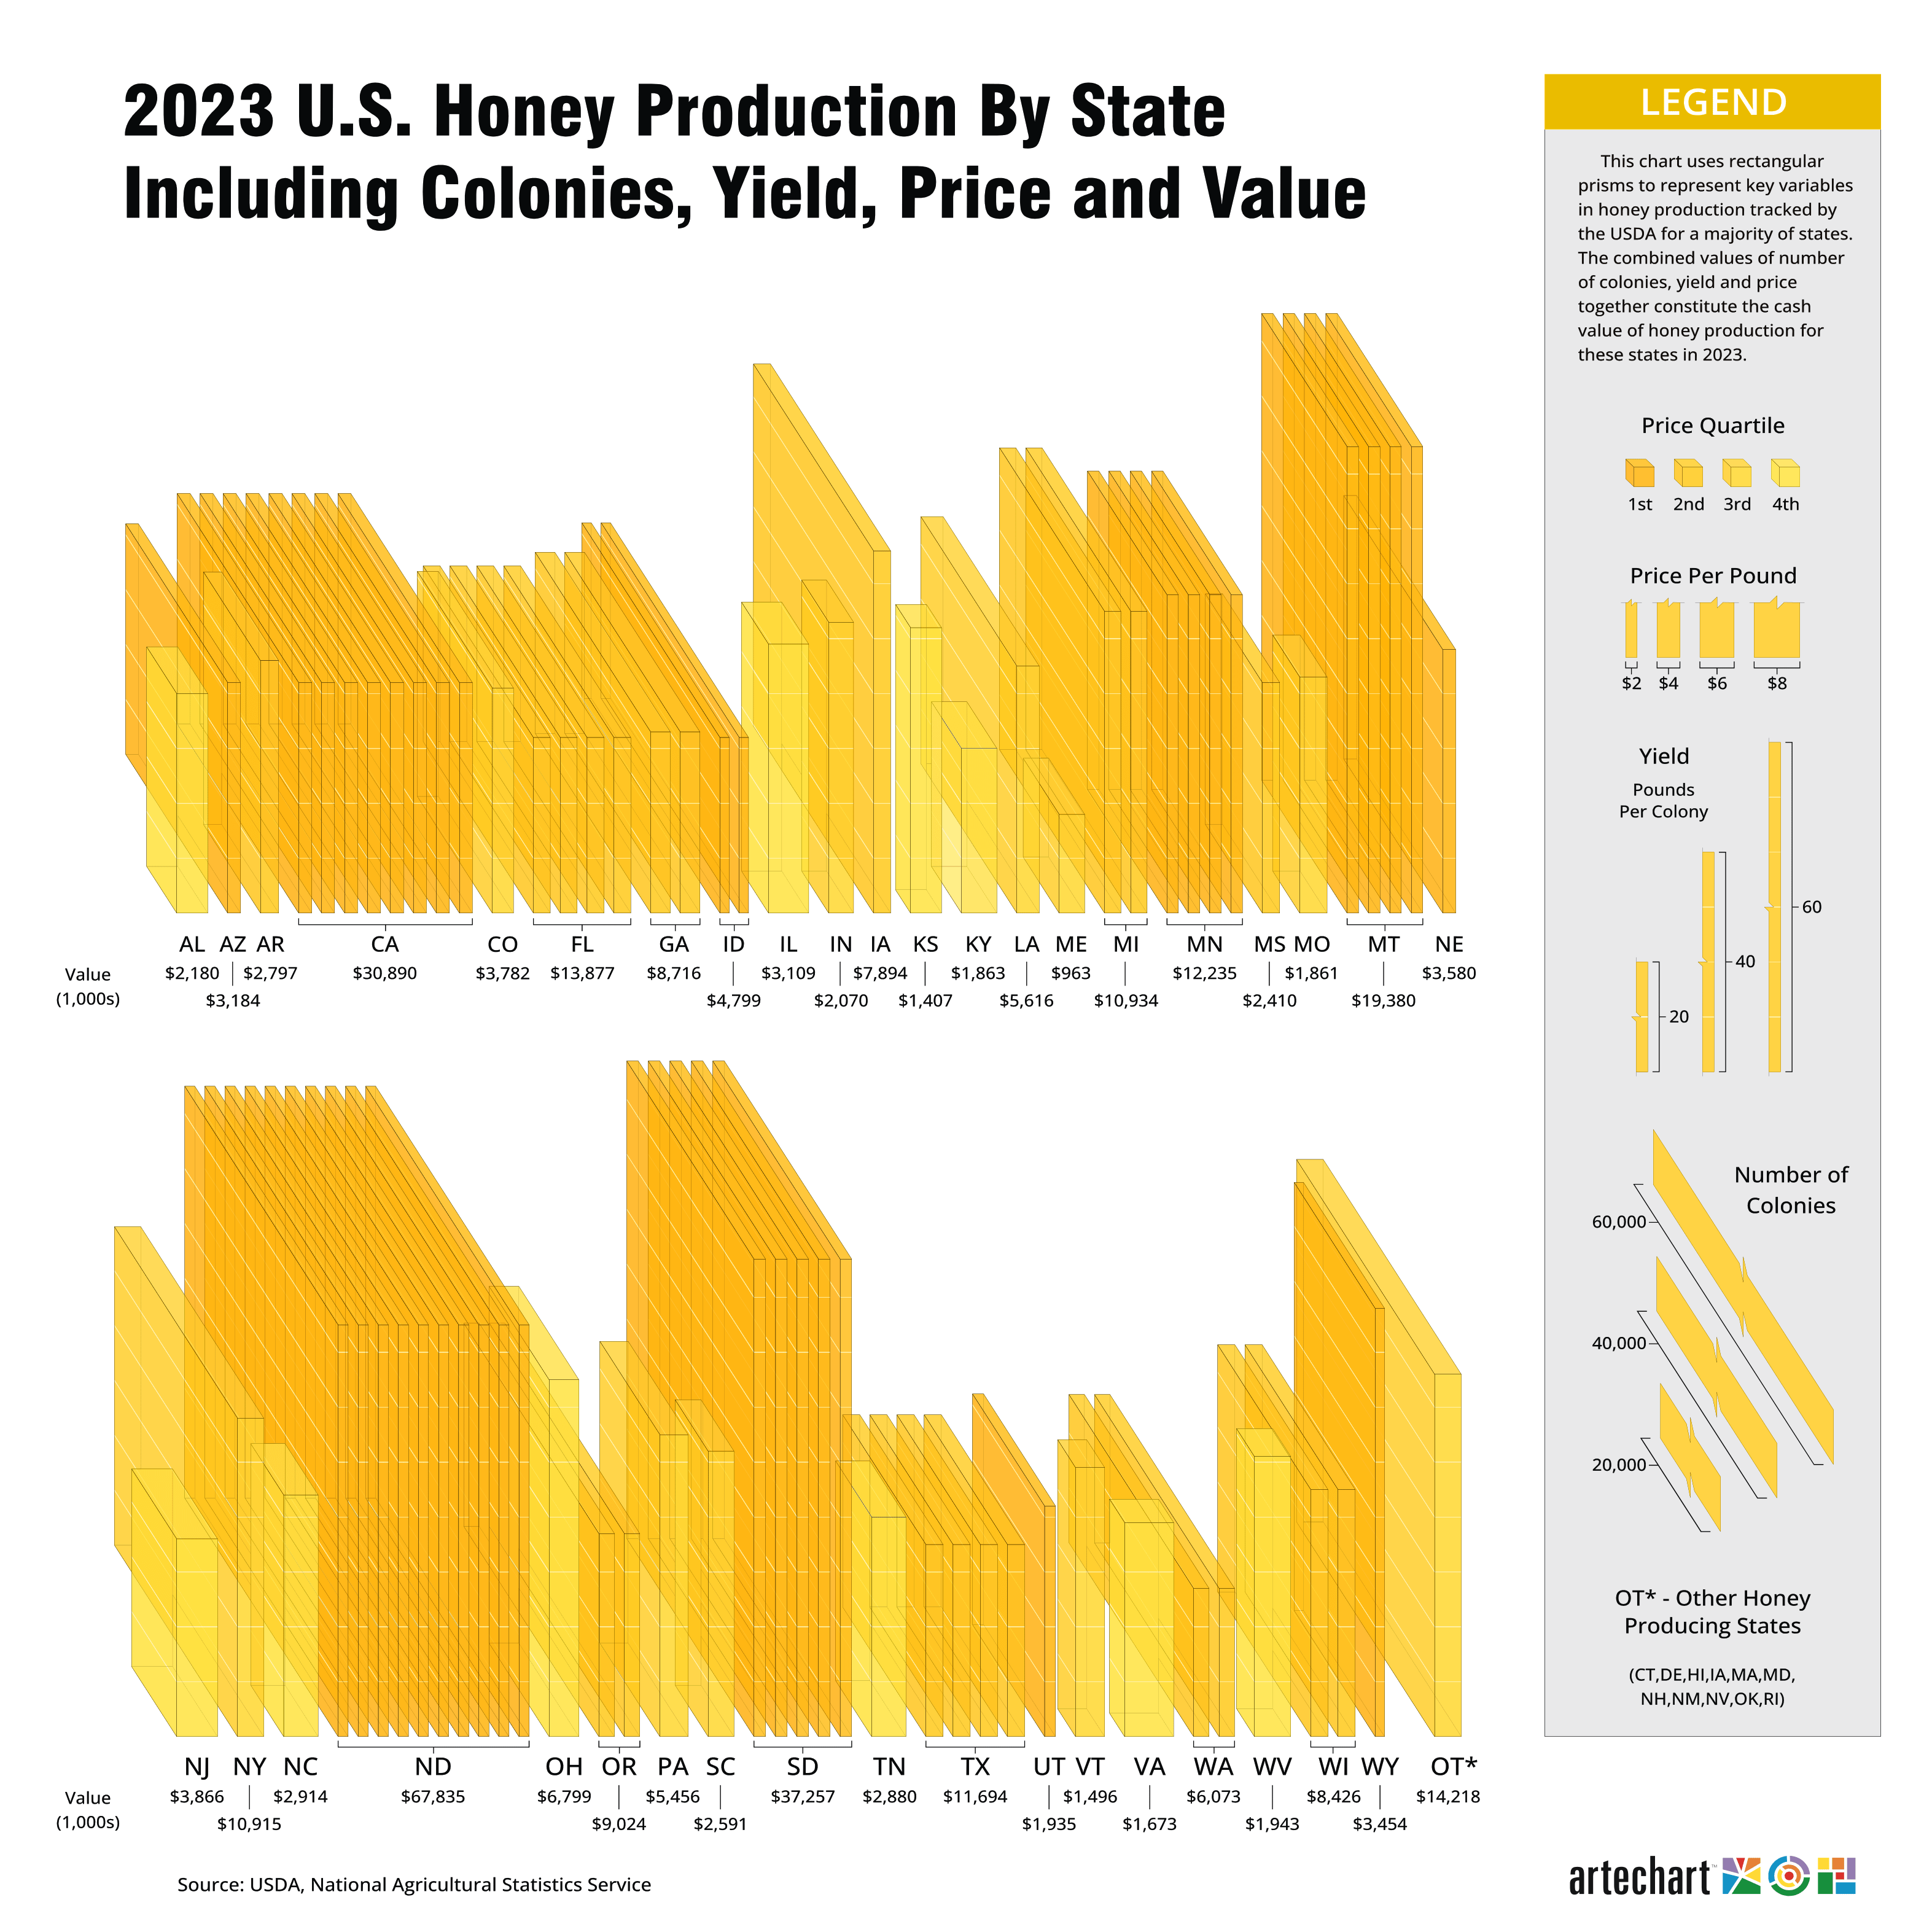
This is a prototype of a type of a chart I want to program, using transparent rectangular prisms to represent multiple variables. In this case — state honey output by receipts — three factors come into play to determine the total revenue: number of bee colonies, yield per colony and price. Because of the size difference between the largest producing states and the rest, I decided to break up largest state’s production into multiple rectangular prisms to preserve the yield and price attributes.
I wanted to use data from 2024, which is normally released on March 15, however the USDA only has data available for roughly half this number of states.
Data is from USDA, National Agricultural Statistics Service. Chart was put together in CorelDraw, number crunching in OpenOffice Calc.
Side note: did you hear the NPR bee segment Monday? There is a issue attacking bees. There was one bee keeper who ended last year with around 1,800 hives and by March 1st had 350 hives. They don’t know what’s causing it and the cuts to by the Trump Admin is making it so there not enough funding and staff to figure out what’s going on.
where is almost all of new england?
interesting display and cool visualization, but it’s hard to compare so many variables among different states. probably better to just have multiple graphs if you actually want a reader to gather information from this data.
This has to be the worst visual representation of data that I have seen.
not a huge fan. it’s not easy figuring out production details. I appreciate the theme with the design but it’s a challenge drilling down for details
Iowa is represented by a slab and is listed in the OT states. About the only time my home state counts double 🙂
this chart is too busy to be beautiful
It’s pretty, but I don’t think it conveys information very well.
It’s too hard to compare the spatial dimensions of the prisms, especially when they’re not adjacent. Also, why do some states have multiple prisms?
Compare it to a bubble chart, where you can immediately tell where a state sits relative to the others and whether there are relationships between the different variables.
The Z-axis data (#of colonies) is almost useless, since most of the rectangular prisms obscure the ones behind them. It also makes height-data difficult to compare in the y-direction.
Would be really useful if instead of being sorted alphabetically they were sorted in order of honey production, so you could compare similar states. Eliminating the z-axis and including that info on a separate plot might be useful, it’s just really difficult to create useful 3D comparison insight due to limitations of projection onto 2D images and human intuition of volume vs. just length.
![[OC] U.S. honey production by state including colonies, yield, price and value](https://www.europesays.com/wp-content/uploads/2025/04/zl239u2chtte1-1920x1024.png)
10 comments
This is a prototype of a type of a chart I want to program, using transparent rectangular prisms to represent multiple variables. In this case — state honey output by receipts — three factors come into play to determine the total revenue: number of bee colonies, yield per colony and price. Because of the size difference between the largest producing states and the rest, I decided to break up largest state’s production into multiple rectangular prisms to preserve the yield and price attributes.
I wanted to use data from 2024, which is normally released on March 15, however the USDA only has data available for roughly half this number of states.
Data is from USDA, National Agricultural Statistics Service. Chart was put together in CorelDraw, number crunching in OpenOffice Calc.
Side note: did you hear the NPR bee segment Monday? There is a issue attacking bees. There was one bee keeper who ended last year with around 1,800 hives and by March 1st had 350 hives. They don’t know what’s causing it and the cuts to by the Trump Admin is making it so there not enough funding and staff to figure out what’s going on.
where is almost all of new england?
interesting display and cool visualization, but it’s hard to compare so many variables among different states. probably better to just have multiple graphs if you actually want a reader to gather information from this data.
This has to be the worst visual representation of data that I have seen.
not a huge fan. it’s not easy figuring out production details. I appreciate the theme with the design but it’s a challenge drilling down for details
Iowa is represented by a slab and is listed in the OT states. About the only time my home state counts double 🙂
this chart is too busy to be beautiful
It’s pretty, but I don’t think it conveys information very well.
It’s too hard to compare the spatial dimensions of the prisms, especially when they’re not adjacent. Also, why do some states have multiple prisms?
Compare it to a bubble chart, where you can immediately tell where a state sits relative to the others and whether there are relationships between the different variables.
The Z-axis data (#of colonies) is almost useless, since most of the rectangular prisms obscure the ones behind them. It also makes height-data difficult to compare in the y-direction.
Would be really useful if instead of being sorted alphabetically they were sorted in order of honey production, so you could compare similar states. Eliminating the z-axis and including that info on a separate plot might be useful, it’s just really difficult to create useful 3D comparison insight due to limitations of projection onto 2D images and human intuition of volume vs. just length.
Comments are closed.