Apr 10, 2025
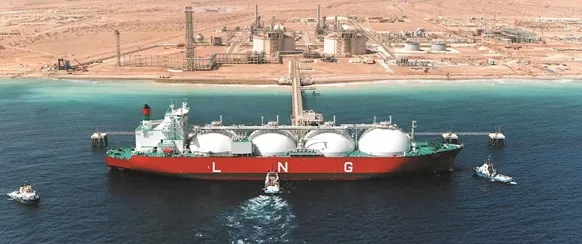
Venture Global Inc is set to transition its LNG sales approach, focusing on long-term customer contracts from its Louisiana export terminal. According to Yahoo Finance, the company will soon complete the commissioning of its Calcasieu Pass facility, which obligates it to fulfill previously signed contracts. This shift comes as Venture Global faces arbitration claims from major companies like Shell and BP, who allege the company delayed plant commissioning to exploit higher spot prices.
Meanwhile, Venture Global’s Plaquemines LNG plant, which began production in mid-December, is capitalizing on the spot market with significant returns. The facility is currently operating at 140% of its design capacity, having sold 29 cargoes at an average liquefaction fee of $7.26 per mmBtu within three months. Analysts forecast that the majority of sales from Plaquemines will continue on the spot market through 2025. According to IndexBox data, the global LNG market is poised for growth, driven by increased demand and strategic operations like those of Venture Global.
Venture Global’s revenue from LNG sales is projected to double to $9.98 billion in 2025, up from $4.972 billion last year, as per UBS’s analysis. The company aims to sell 550 cargoes from Plaquemines during its commissioning phase, potentially generating $10 to $12 billion. Despite this growth, the company faces legal challenges from contracted customers seeking arbitration over delayed supply agreements.
As the U.S. solidifies its position as a leading global LNG supplier, Venture Global remains a key player, second only to Cheniere in export capacity. The ongoing legal disputes underscore the complexities of balancing spot market opportunities with long-term contractual obligations.
1. INTRODUCTION
Making Data-Driven Decisions to Grow Your Business
REPORT DESCRIPTION
RESEARCH METHODOLOGY AND AI PLATFORM
DATA-DRIVEN DECISIONS FOR YOUR BUSINESS
GLOSSARY AND SPECIFIC TERMS
2. EXECUTIVE SUMMARY
A Quick Overview of Market Performance
KEY FINDINGS
MARKET TRENDS
This Chapter is Available Only for the Professional Edition
PRO
3. MARKET OVERVIEW
Understanding the Current State of The Market and Its Prospects
MARKET SIZE
MARKET STRUCTURE
TRADE BALANCE
PER CAPITA CONSUMPTION
MARKET FORECAST TO 2030
4. MOST PROMISING PRODUCT
Finding New Products to Diversify Your Business
This Chapter is Available Only for the Professional Edition
PRO
TOP PRODUCTS TO DIVERSIFY YOUR BUSINESS
BEST-SELLING PRODUCTS
MOST CONSUMED PRODUCT
MOST TRADED PRODUCT
MOST PROFITABLE PRODUCT FOR EXPORT
5. MOST PROMISING SUPPLYING COUNTRIES
Choosing the Best Countries to Establish Your Sustainable Supply Chain
This Chapter is Available Only for the Professional Edition
PRO
TOP COUNTRIES TO SOURCE YOUR PRODUCT
TOP PRODUCING COUNTRIES
TOP EXPORTING COUNTRIES
LOW-COST EXPORTING COUNTRIES
6. MOST PROMISING OVERSEAS MARKETS
Choosing the Best Countries to Boost Your Exports
This Chapter is Available Only for the Professional Edition
PRO
TOP OVERSEAS MARKETS FOR EXPORTING YOUR PRODUCT
TOP CONSUMING MARKETS
UNSATURATED MARKETS
TOP IMPORTING MARKETS
MOST PROFITABLE MARKETS
7. PRODUCTION
The Latest Trends and Insights into The Industry
PRODUCTION VOLUME AND VALUE
8. IMPORTS
The Largest Import Supplying Countries
IMPORTS FROM 2012–2024
IMPORTS BY COUNTRY
IMPORT PRICES BY COUNTRY
9. EXPORTS
The Largest Destinations for Exports
EXPORTS FROM 2012–2024
EXPORTS BY COUNTRY
EXPORT PRICES BY COUNTRY
10. PROFILES OF MAJOR PRODUCERS
The Largest Producers on The Market and Their Profiles
This Chapter is Available Only for the Professional Edition
PRO
LIST OF TABLES
Key Findings In 2024
Market Volume, In Physical Terms, 2012–2024
Market Value, 2012–2024
Per Capita Consumption In 2012-2024
Imports, In Physical Terms, By Country, 2012–2024
Imports, In Value Terms, By Country, 2012–2024
Import Prices, By Country Of Origin, 2012–2024
Exports, In Physical Terms, By Country, 2012–2024
Exports, In Value Terms, By Country, 2012–2024
Export Prices, By Country Of Destination, 2012–2024
LIST OF FIGURES
Market Volume, In Physical Terms, 2012–2024
Market Value, 2012–2024
Market Structure – Domestic Supply vs. Imports, In Physical Terms, 2012-2024
Market Structure – Domestic Supply vs. Imports, In Value Terms, 2012-2024
Trade Balance, In Physical Terms, 2012-2024
Trade Balance, In Value Terms, 2012-2024
Per Capita Consumption, 2012-2024
Market Volume Forecast to 2030
Market Value Forecast to 2030
Products: Market Size And Growth, By Type
Products: Average Per Capita Consumption, By Type
Products: Exports And Growth, By Type
Products: Export Prices And Growth, By Type
Production Volume And Growth
Exports And Growth
Export Prices And Growth
Market Size And Growth
Per Capita Consumption
Imports And Growth
Import Prices
Production, In Physical Terms, 2012–2024
Production, In Value Terms, 2012–2024
Imports, In Physical Terms, 2012–2024
Imports, In Value Terms, 2012–2024
Imports, In Physical Terms, By Country, 2024
Imports, In Physical Terms, By Country, 2012–2024
Imports, In Value Terms, By Country, 2012–2024
Import Prices, By Country Of Origin, 2012–2024
Exports, In Physical Terms, 2012–2024
Exports, In Value Terms, 2012–2024
Exports, In Physical Terms, By Country, 2024
Exports, In Physical Terms, By Country, 2012–2024
Exports, In Value Terms, By Country, 2012–2024
Export Prices, By Country Of Destination, 2012–2024