![Visualization of Sleeping Patterns in First Year of life [OC]](https://www.europesays.com/wp-content/uploads/2025/04/b9pdzdpcz9ue1-1920x1024.png)
Another one of these posts (such as this one https://www.reddit.com/r/dataisbeautiful/comments/e1kg7t/visualization_of_sleeping_patterns_in_a_newborns/ ) but I think they're always fun.
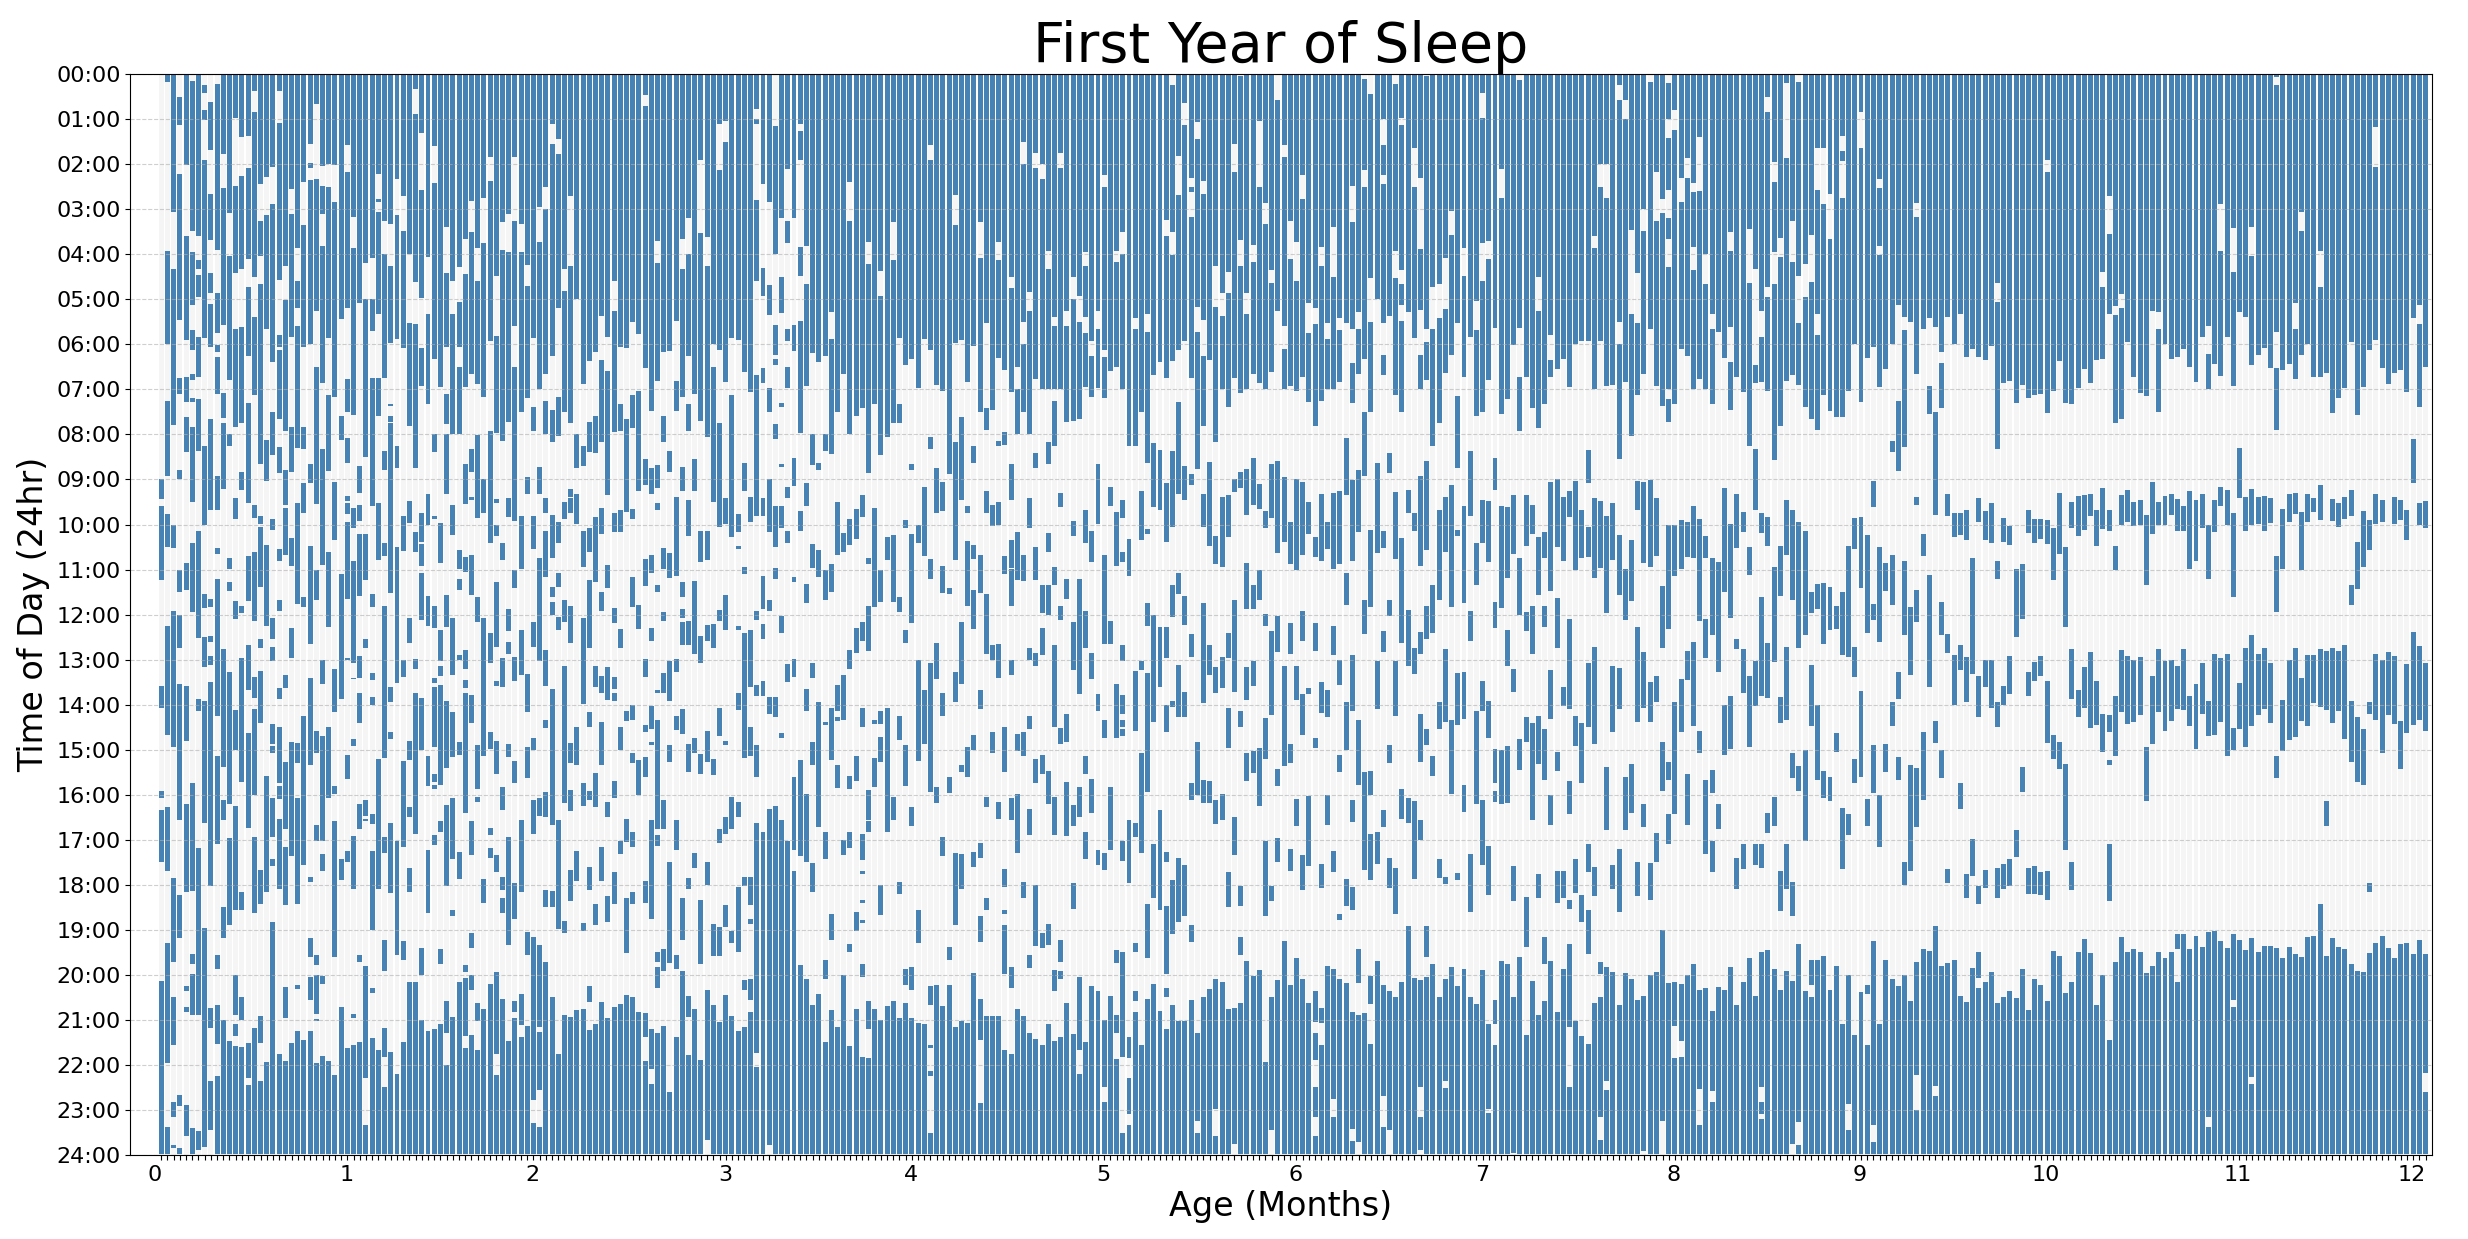
Used Huckleberry app for (manual) data tracking, exported data to csv, formatted using notepad, and plotted using python in windows powershell (thanks for teaching me how, Gemini). /u/jiuguangw's post from seemed a bit complex to get running to me as a layman so I created my own that runs from just an input csv and a single python script (posted in comments).
That shifted week of sleep at 3 months old was from a trip overseas, shown in home local time, not local time overseas.
Posted by shouldajustsaid_yeah
11 comments
Wow. That’s really cool to see the patterns start to coalesce!
Reddit giving me errors when posting the python code – linking to pastebin instead:
[https://pastebin.com/64esmTyR](https://pastebin.com/64esmTyR)
The early mornings near 3 months is nightmare fuel
Really great visualisation, sits well in this thread
Babies are kings of power napping 😎
Wow, it’s the opposite of what happened to Elon Musk
super cool to look at, thank you! didn’t realize how much (and how sporadically) they sleep in the first couple months!
It almost looks like the first nap of the day shifted down into the second and a new nap became the first.
It’s so interesting how different each baby is. Comparing this to the wheel Huckleberry gives for my son we had way more night wakings but a much sooner coalescing into 3 then 2 naps.
Lmao that one week stint where you discovered the baby will sleep for a solid 8 hours, but only if they start at 4pm 😂
Very cool. Looks like a hard drive defragmenting itself.
One of the rare posts in this sub that is actually beautiful data. Good job!
Comments are closed.