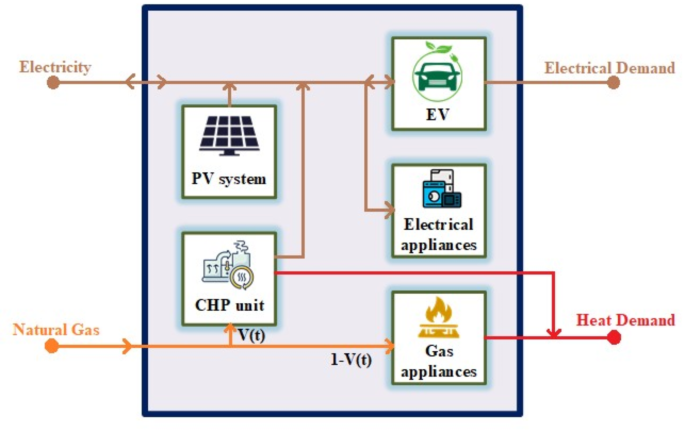
This section proposes three cases to study optimal energy consumption patterns for cost minimization, particularly focusing on the impact of RES on EV battery charge/discharge scheduling. Analysis centered on a sample winter day (January 1st) for its relevance to heat demand and optimizing REH during low PV output. The energy optimization simulations were performed using GAMS 38.2. The official source for this software can be accessed at https://www.gams.com/. Structural analysis was conducted using Abaqus 2022. The software is available at https://www.3ds.com/products-services/simulia/products/abaqus/. The characteristic and quantity of installed appliances as well as the energy usages of appliances in the studied residential home are taken from29. Figure 2 illustrates the electrical demand of studied residential home.
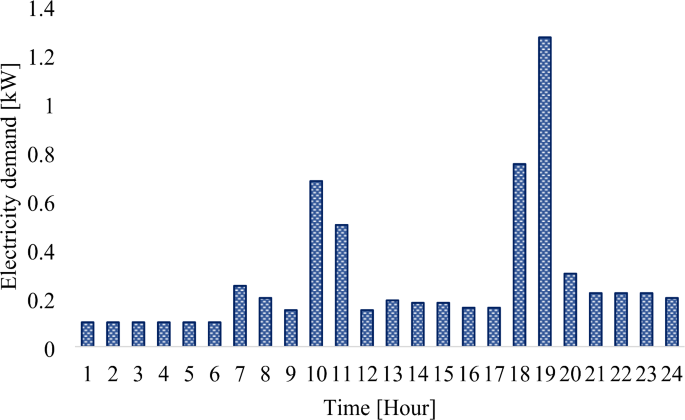
Electrical demand of REH.
While not conducting precise heat loss analysis, an assumed overall heat transfer rate calculates losses for a 7 × 9 m residential home. Recommended U values (0.45 W/m2K for roof, 0.6 W/m2K for wall) improve by 30% to 0.31 and 0.39. Overall heat transfer rate is 0.054 kW/K, allowing hourly heating demand calculation, as illustrated in Fig. 3 for January 1st.
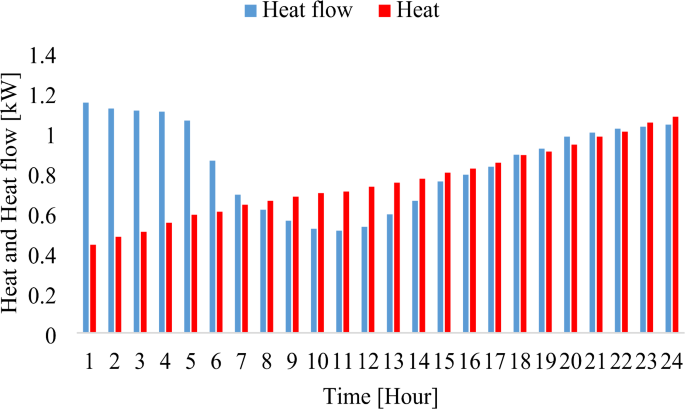
Hourly heat flow values and the summations on the 1st of January.
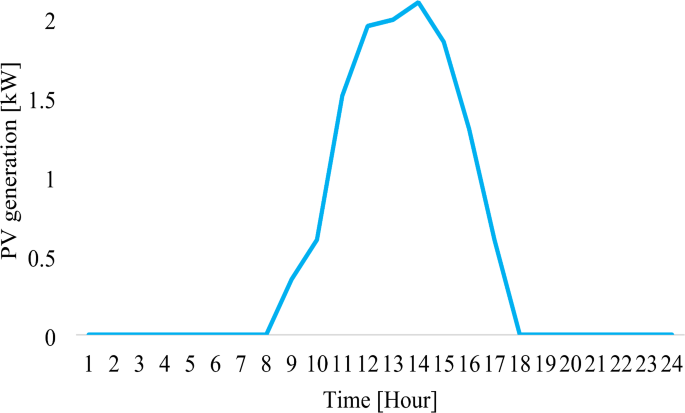
The power output of the PV system (PPV) is calculated by PVSyst software and shown in Fig. 4.
The min/max SOC of EV battery are reported in28. The micro-CHP unit is treated as a fuel cell-based system in this investigation.
The parameters relevant to the installation costs are given in Table 2.
The electricity price of PV generation is considered 0.054 $/kWh. After evaluating various factors, the most suitable PV array with the highest cost reduction potential are chosen, as their costs significantly impact overall optimization. The residential energy hub optimization is solved in three case studies for a 24-h period. The optimization problem in each case is addressed using power flow equations, i.e. Equations (1)–(5). Natural gas supply is assumed to be 30% higher than heat demand, ensuring ample supply for both heating and the CHP unit.
Case I—Optimal operation of the residential energy hub without RES
In Case I, we establish the baseline for the residential energy hub’s optimal operation without RES using a 0.75 kW CHP unit to maintain overall balance. Daily electricity and heat demands on a winter day are met through a combination of the electrical grid and natural gas, exceeding the heat demand by 30%.
Figure 5 presents the energy input and demand patterns in the Residential Energy Hub (REH) under Case I, where no renewable energy sources (RES) are integrated, and a 0.75 kW combined heat and power (CHP) unit is used to balance energy supply. The figure highlights four key variables: electricity input, natural gas input, electrical demand, and heat demand, over a 24-h winter day. Analyzing the fluctuations and trends in these parameters provides insights into the operational efficiency and limitations of the REH in the absence of RES and Home Energy Management (HEM) strategies.
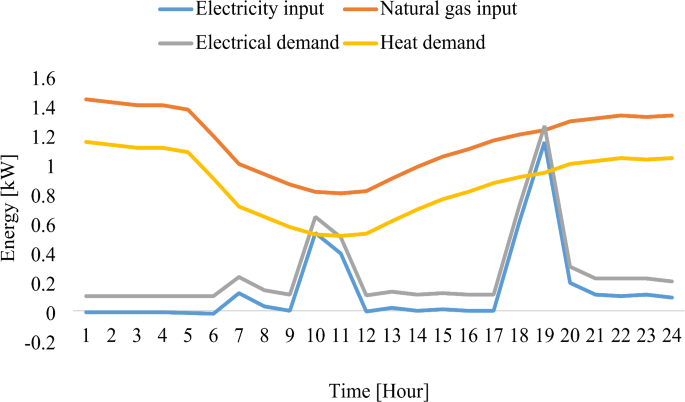
The inputs and demands of the REH in Case I.
The natural gas input (orange line) follows a relatively stable trajectory, gradually declining from around 1.4 kW in the early hours to its lowest point around noon, before increasing again during the evening. This trend suggests that the CHP unit operates consistently to meet heat demand, but its usage is slightly reduced during midday, likely due to a combination of lower heating requirements and thermal retention within the household.
The heat demand (yellow line) displays a characteristic U-shaped pattern, reaching its lowest value around noon before increasing steadily in the afternoon and peaking in the late evening. This behavior aligns with typical household heating demand in winter, where space heating is needed more during the early morning and late evening when outdoor temperatures are lower. The gap between natural gas input and heat demand suggests that the system maintains a surplus of around 30% to ensure reliability and accommodate possible variations in heating needs.
The electrical demand (gray line) exhibits notable fluctuations throughout the day, with two significant peaks occurring around 10:00 and 19:00. These peaks correspond to typical morning and evening household activities, such as cooking, heating, and appliance usage. This pattern indicates that a considerable portion of the household’s electrical load consists of non-flexible appliances, which operate based on user behavior rather than optimization strategies.
The electricity input (blue line) remains low for most of the day, fluctuating in response to demand. However, there is a sharp spike around 19:00, indicating a higher reliance on grid electricity during peak evening hours. This is likely due to the limited capacity of the CHP unit, which is unable to fully meet electricity demand at these times. Consequently, additional grid electricity is required to compensate for the shortfall, leading to an increase in operational costs and grid dependency.
A key observation from Fig. 5 is that the CHP system alone is insufficient to fully support both heat and electricity demand, particularly during peak periods. The evening peak in electricity input suggests that without energy storage or renewable generation, the household remains reliant on grid electricity, especially when demand exceeds CHP output capacity. This limitation highlights the potential benefits of incorporating RES, such as photovoltaic (PV) panels, to supplement electricity supply and reduce grid dependency.
Another important takeaway is the misalignment between peak electricity demand and CHP operation. The natural gas input remains relatively steady, while electricity demand spikes significantly during specific hours. This mismatch suggests that a more optimized scheduling strategy for the CHP unit could improve energy efficiency. Additionally, implementing demand-side management and HEM strategies could help shift flexible loads to off-peak hours, further reducing grid reliance and improving overall cost efficiency.
Case II—Case I with solar panels and EV battery scheduling
In Case II, we develope Case I by integrating a PV system with an EV. The goal is to improve energy efficiency and reduce cost by EV battery scheduling. In the other words, Case II explores the impact of introducing RES with EV, considering solar panels. In this case, 2.8 kWp power solar panels are assumed to be mounted on residential rooftops. The output power produced by this solar system is illustrated in Fig. 4. Additionally, a 25 kWh EV is considered to store energy during excess production hours.
Figure 6 illustrates the energy input, natural gas input, electrical demand, and PV power generation for the Residential Energy Hub (REH) under Case II, where a PV system and an electric vehicle (EV) battery are integrated into the system. The figure provides insights into how the introduction of renewable energy and energy storage influences the energy dynamics compared to Case I.
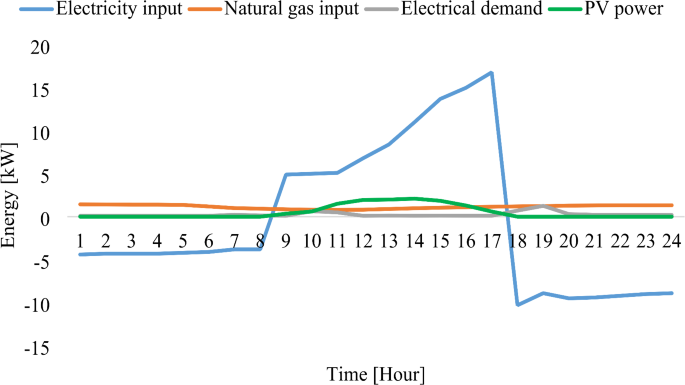
The inputs and demands of the REH in Case II.
The green line represents PV power output, which follows a typical daily solar generation curve. The output starts increasing around 8:00 AM, reaching its peak between 12:00 PM and 2:00 PM, and gradually declining after that until sunset. This pattern corresponds to the availability of solar radiation throughout the day, with peak generation occurring when solar intensity is highest. During these hours, excess PV output is stored in the EV battery, allowing energy to be used later in the day when demand increases and PV generation diminishes.
The blue line represents the electricity input, which demonstrates significant fluctuations due to the interaction between PV power, demand, and EV battery operation. The electricity input remains negative during the early morning hours (1:00–8:00 AM), indicating battery charging or energy storage mode where the EV battery is absorbing energy to prepare for the day ahead. After 9:00 AM, as PV generation increases, electricity input shifts positive, signifying that the system is no longer relying on external electricity sources.
A significant increase in electricity input from 9:00 AM to 5:00 PM indicates that the EV battery is charging using excess PV power, aligning with the available solar energy. This strategic scheduling reduces dependence on grid electricity and maximizes the utilization of solar generation. However, a sharp drop in electricity input occurs after 6:00 PM, as the battery starts discharging to supply household demand when PV output decreases. This is evident from the steep decline in electricity input between 6:00 PM and 8:00 PM, where the EV battery shifts from charging to discharging mode to support peak demand hours.
The gray line represents electrical demand, which remains relatively stable throughout the day, with slight peaks in the morning (around 9:00 AM) and evening (6:00–8:00 PM). These peaks correspond to typical household energy usage patterns, such as cooking, lighting, and appliance operation. The PV system and EV battery significantly reduce grid reliance during the daytime, but some dependence on the grid remains, particularly in the evening when demand rises, and PV power is no longer available.
The orange line, representing natural gas input, remains relatively stable throughout the day, similar to Case I. This suggests that the introduction of PV and EV storage primarily impacts electricity input and demand, while heat demand remains consistent, requiring a steady supply of natural gas. The presence of CHP may still contribute to heat generation, but since natural gas input does not exhibit drastic variations, it implies that electrification strategies alone do not significantly alter thermal energy needs.
The figure demonstrates the successful integration of PV and EV storage into the energy hub, reducing grid dependence and optimizing energy usage. The EV battery effectively stores excess PV energy during peak generation hours and discharges during the evening peak, helping to stabilize electricity demand. The strategic charging and discharging behavior of the EV battery aligns well with the PV generation curve, reducing reliance on external electricity sources and lowering overall energy costs.
However, the sharp drop in electricity input after 6:00 PM suggests that further improvements, such as larger battery capacity or demand-side management strategies, could further enhance energy self-sufficiency. Additionally, integrating demand response strategies to shift some evening loads to earlier in the day (when PV power is available) could further optimize the system’s efficiency and minimize electricity input from external sources.
Case III—Incorporating HEM and time-of-use (ToU) tariff with Case II
In Case III, we optimize the model by integrating HEM and a ToU tariff, building on features from Case II. This refines the scheduling of flexible appliances to minimize customer costs. By incorporating HEM and a ToU tariff, the model achieves a sophisticated and cost-effective approach to managing energy consumption under varying tariff structures.
Case III incorporates HEM into Case II, considering a flexible load curve as shown in Fig. 7. Hourly demand details for flexible and non-flexible devices are shown in Fig. 8, with lower non-flexible load during winter.
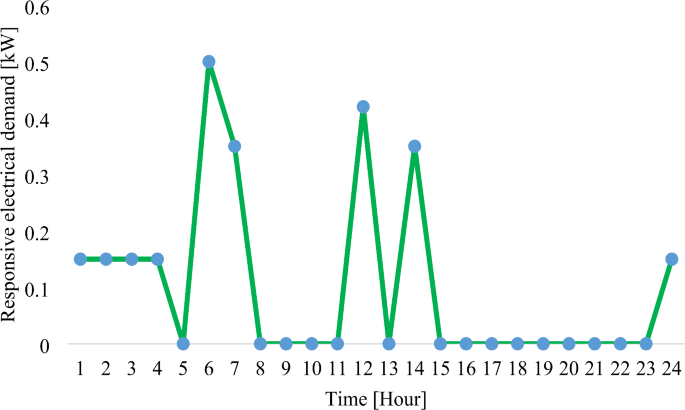
Flexible appliances’ demand.
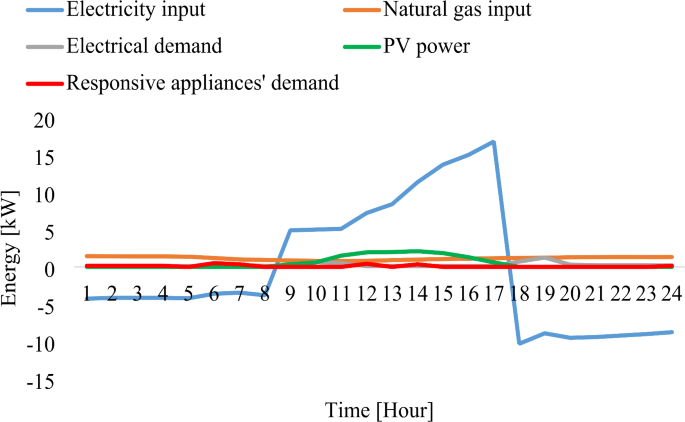
The inputs and demands of the REH in Case III.
During winter, peak hours are from 2:00 pm to 5:00 pm, partial-peak hours occur between 10:00 am to 12:00 pm and 5:00 pm to 7:00 pm, while all other hours are considered off-peak. In summer, the peak period shifts to 4:00 pm to 8:00 pm, with the same partial-peak hours as in winter, and the remaining hours classified as off-peak. Additionally, the Inclining Block Rate (IBR) tariff applied in Case III, shown in Table 2, sets different electricity prices based on consumption thresholds. In winter, electricity usage below the IBR threshold (2 kW) is charged at $0.101/kWh, while consumption exceeding this limit is priced at $0.159/kWh. Similarly, for summer, the IBR threshold is increased to 2.5 kW, with rates of $0.1127/kWh for consumption below this limit and $0.1753/kWh for higher usage.
Figure 8 shows the EV battery charges during excess PV output and discharges when production falls short. Charging and discharging are smoother than in Case II, indicating improved overall performance despite a small difference due to winter demand.
Table 3 illustrates an initial investment of $1260 and an annual fixed O&M cost of $30.8.
Table 3 provides a cost comparison across three cases related to electricity consumption, presenting both direct expenses and the economic benefits of integrating renewable energy and Home Energy Management (HEM) strategies. In Case I, where no renewable energy sources are integrated, the average annual electricity demand is 3648 kWh, leading to yearly household payments of $197. This represents a cost of approximately $0.054/kWh, making the household entirely dependent on grid electricity.
In Case II, the integration of a photovoltaic (PV) system significantly alters the cost structure. The initial investment for the PV system is $1240, with an annual operation and maintenance (O&M) cost of $31, sustained over a lifespan of 19 years. The yearly energy generation from the PV system is 4392 kWh, which not only covers the household’s electricity demand but also results in a net surplus of 744 kWh per year that can be injected into the grid or stored for future use. The levelized cost of electricity (LCOE) is $0.02/kWh, which is significantly lower than the grid electricity cost in Case I ($0.054/kWh). This suggests that investing in a PV system can lead to considerable long-term savings, despite the initial capital investment. Additionally, the surplus energy generated could be leveraged in a net metering or peer-to-peer trading system, further enhancing cost-effectiveness.
In Case III, the impact of HEM and flexible load management on daily electricity expenses is evaluated. Without HEM, the daily electricity payment is $0.54, whereas incorporating HEM reduces it to $0.45 per day, resulting in an annual savings of approximately $32.85 (based on a 365-day year). This reduction of about 16.7% in daily electricity costs highlights the benefits of demand-side management strategies, which optimize energy consumption by shifting flexible loads to off-peak hours, thus reducing peak demand charges. Additionally, the synergy between HEM and PV integration could further enhance cost savings by ensuring that electricity consumption is maximized during periods of high solar energy generation, minimizing reliance on the grid.
The results indicate that integrating renewable energy (Case II) and load flexibility strategies (Case III) significantly enhances cost efficiency compared to grid dependency (Case I). While Case II requires a higher initial investment, its long-term benefits in terms of lower LCOE and potential energy independence make it a financially viable option. On the other hand, Case III demonstrates that even without renewable energy integration, optimizing electricity consumption through HEM results in tangible cost reductions.
From a sustainability perspective, Case II also provides environmental benefits by reducing reliance on fossil-fuel-based grid electricity, thereby lowering carbon emissions. Additionally, in electricity markets with dynamic pricing, the combination of PV systems and demand-side flexibility could further increase savings by strategically consuming energy when prices are lower.
In conclusion, the analysis underscores that a combination of PV generation (Case II) and HEM strategies (Case III) presents the most cost-effective solution, providing both long-term economic and environmental advantages. The results support the importance of integrating smart energy solutions in residential settings to enhance affordability, efficiency, and sustainability in electricity consumption.
The simulation results highlight key contributions and findings, demonstrating that PV integration significantly reduces electricity costs, with a levelized cost of electricity (LCOE) of $0.02/kWh, making solar power a highly cost-effective alternative to grid electricity. Additionally, implementing Home Energy Management (HEM) strategies improves economic efficiency, reducing daily electricity costs by 16.7% through optimized load scheduling. The combination of PV and HEM enhances energy independence and demand flexibility, enabling households to gain greater control over their energy consumption, reduce peak loads, and maintain a more stable and predictable electricity bill. Moreover, the findings confirm the long-term financial viability of PV investments, as the initial installation cost of $1240 is offset over time through consistent energy savings. Finally, the surplus energy generation in Case II opens opportunities for future expansion, such as energy trading, battery storage integration, and dynamic pricing models, which could further enhance cost savings and energy efficiency in residential energy hubs.
Value of the work and findings
This study contributes both practically and scientifically to the evolving field of energy informatics, particularly in the optimization of residential energy hubs (REHs) through the integration of renewable energy sources (RESs), electric vehicles (EVs), and home energy management (HEM) strategies. By leveraging advanced optimization methodologies, the research provides data-driven insights into cost-effective and flexible energy management solutions that are directly applicable to real-world residential energy systems.
From a practical standpoint, the findings underscore the significant economic and operational advantages of integrating EVs and RESs into household energy management. The study demonstrates that coordinated energy scheduling, optimal battery utilization, and intelligent load management can lead to substantial reductions in consumer electricity expenses while minimizing reliance on the central grid. The incorporation of EVs as mobile energy storage units further enhances the flexibility and self-sufficiency of REHs, paving the way for greater adoption of vehicle-to-grid (V2G) and peer-to-peer (P2P) energy trading models. Additionally, the proposed methodology aligns with sustainability goals by improving energy efficiency, reducing emissions, and promoting decentralized renewable energy adoption.
On a scientific level, this research addresses a key gap in the energy informatics domain by presenting a mathematical optimization framework that captures the interplay between RES generation, energy storage, and demand-side flexibility. The use of GAMS 38.2 and the CPLEX solver provides a rigorous, replicable, and scalable approach to energy system modeling, offering valuable insights for researchers and practitioners working on multi-objective energy optimization problems. The study also contributes to the broader discourse on smart grids and digital energy management, illustrating how optimization algorithms, time-of-use (ToU) pricing models, and demand response strategies can be effectively integrated to maximize economic and operational efficiency.
Furthermore, the work highlights the importance of holistic energy system design, considering both technological advancements and consumer engagement. By situating HEM, EV integration, and local energy trading within the larger context of energy informatics and smart grid evolution, this study provides a foundational framework for future advancements in decentralized energy management. The insights derived from this research are highly relevant to policymakers, energy system operators, and residential consumers, offering actionable strategies to enhance grid resilience, improve energy affordability, and accelerate the transition to sustainable energy solutions.
This study bridges the gap between optimization methodologies and real-world energy applications, reinforcing the critical role of energy informatics in shaping next-generation energy systems. Future research could further extend these findings by incorporating dynamic market participation, real-time optimization techniques, and blockchain-based transaction mechanisms, fostering a more interconnected, efficient, and sustainable residential energy landscape.