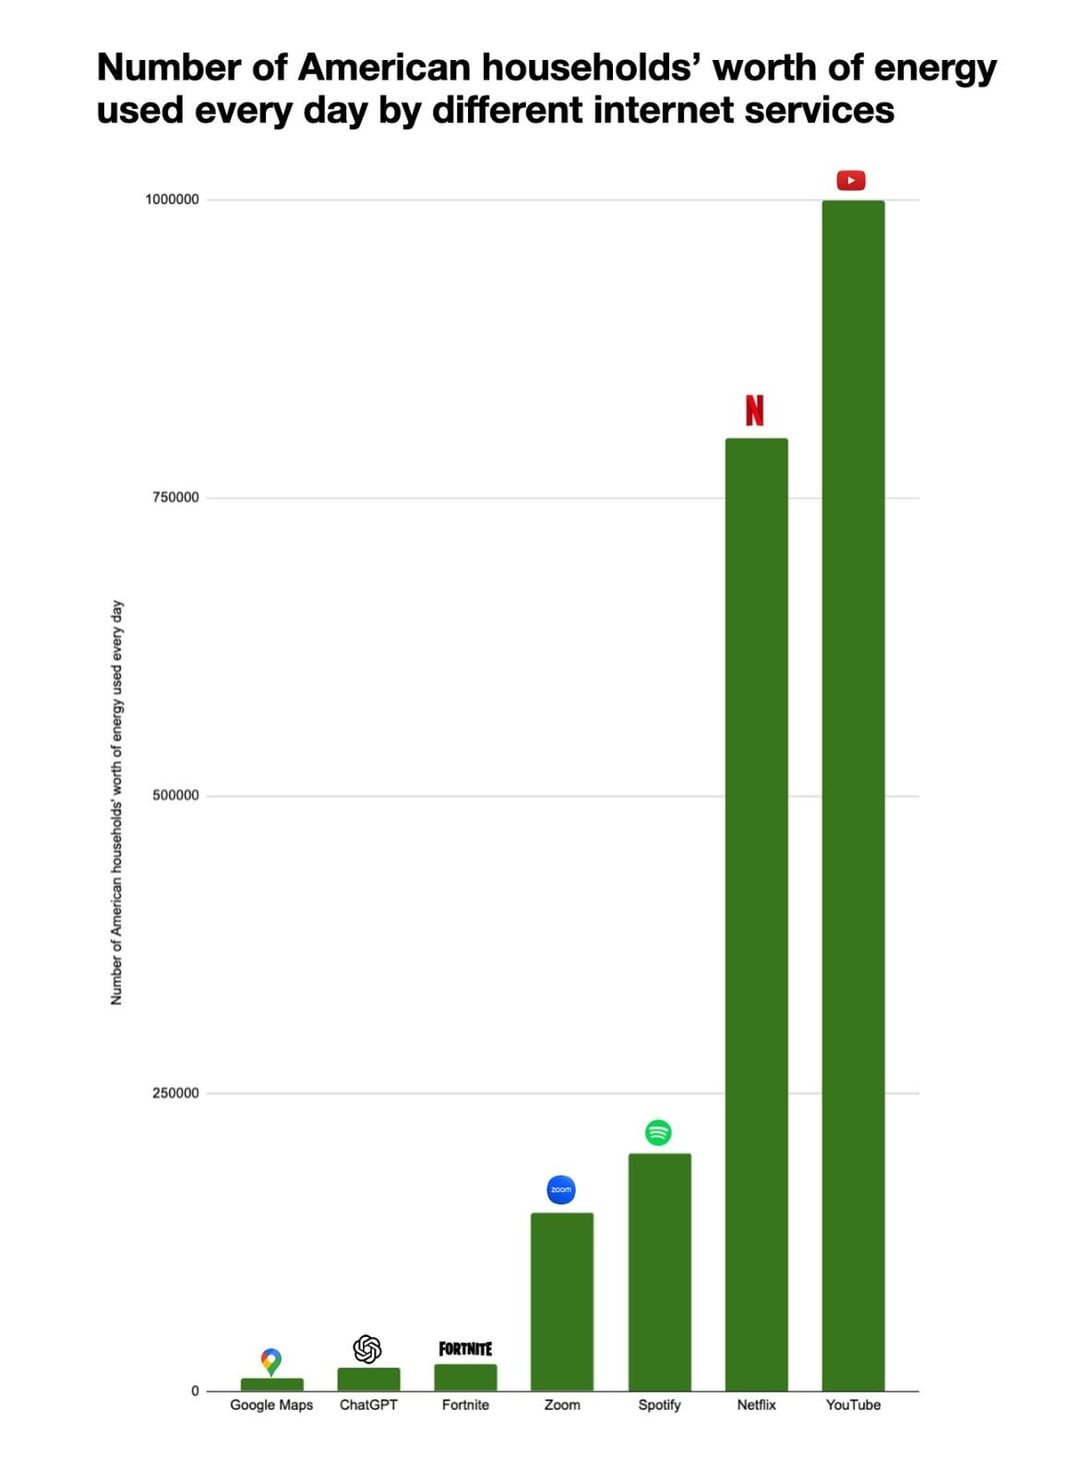
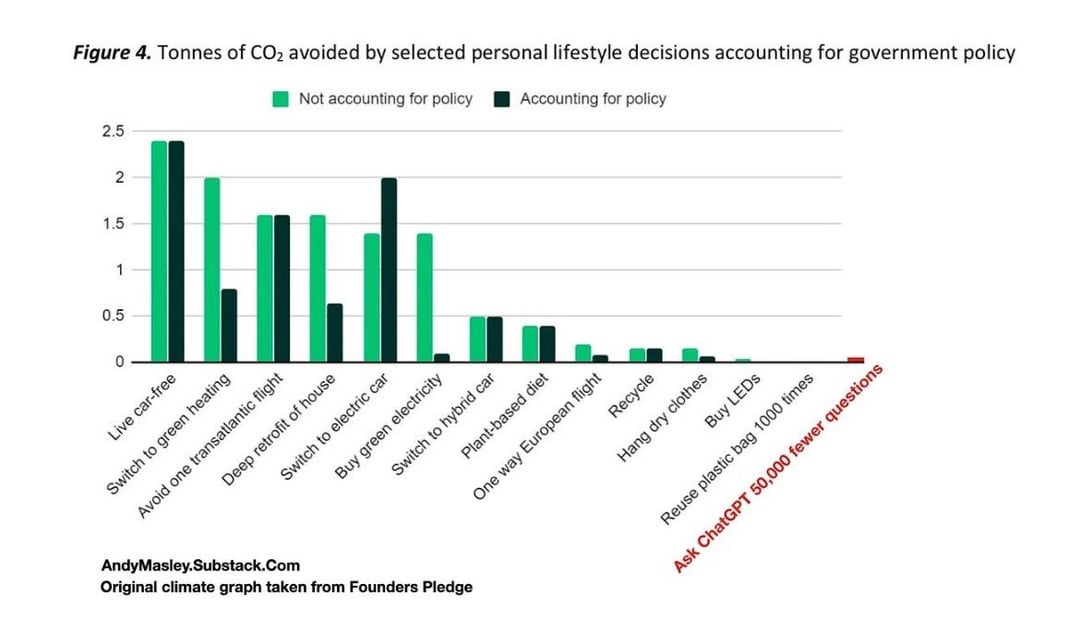
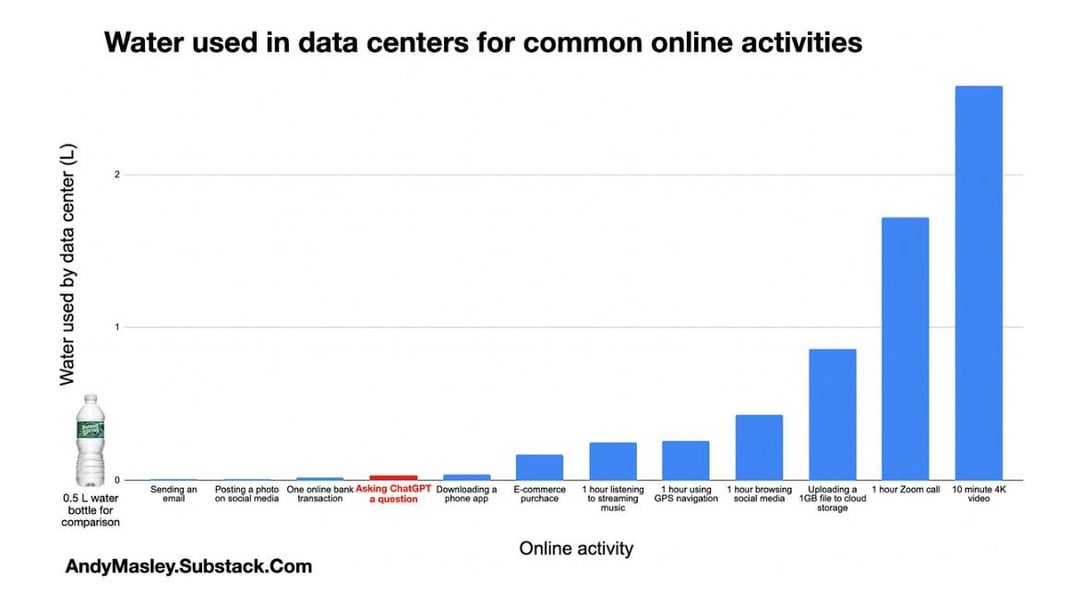
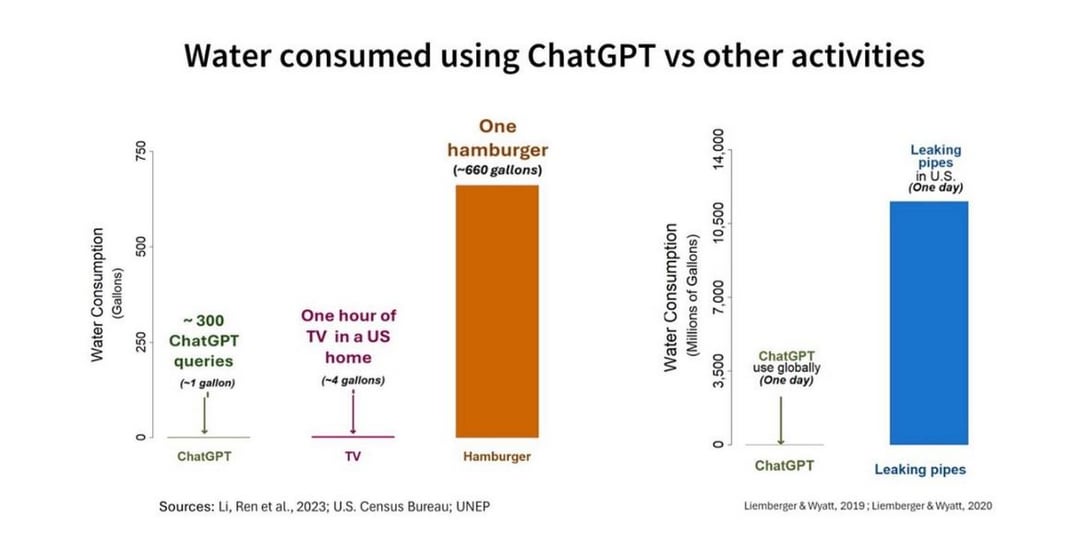
All charts sourced from Andy Masley’s Substack article “Using ChatGPT is not bad for the environment:” https://open.substack.com/pub/andymasley/p/individual-ai-use-is-not-bad-for?r=449ws6&utm_medium=ios
Posted by Interesting-Type3153
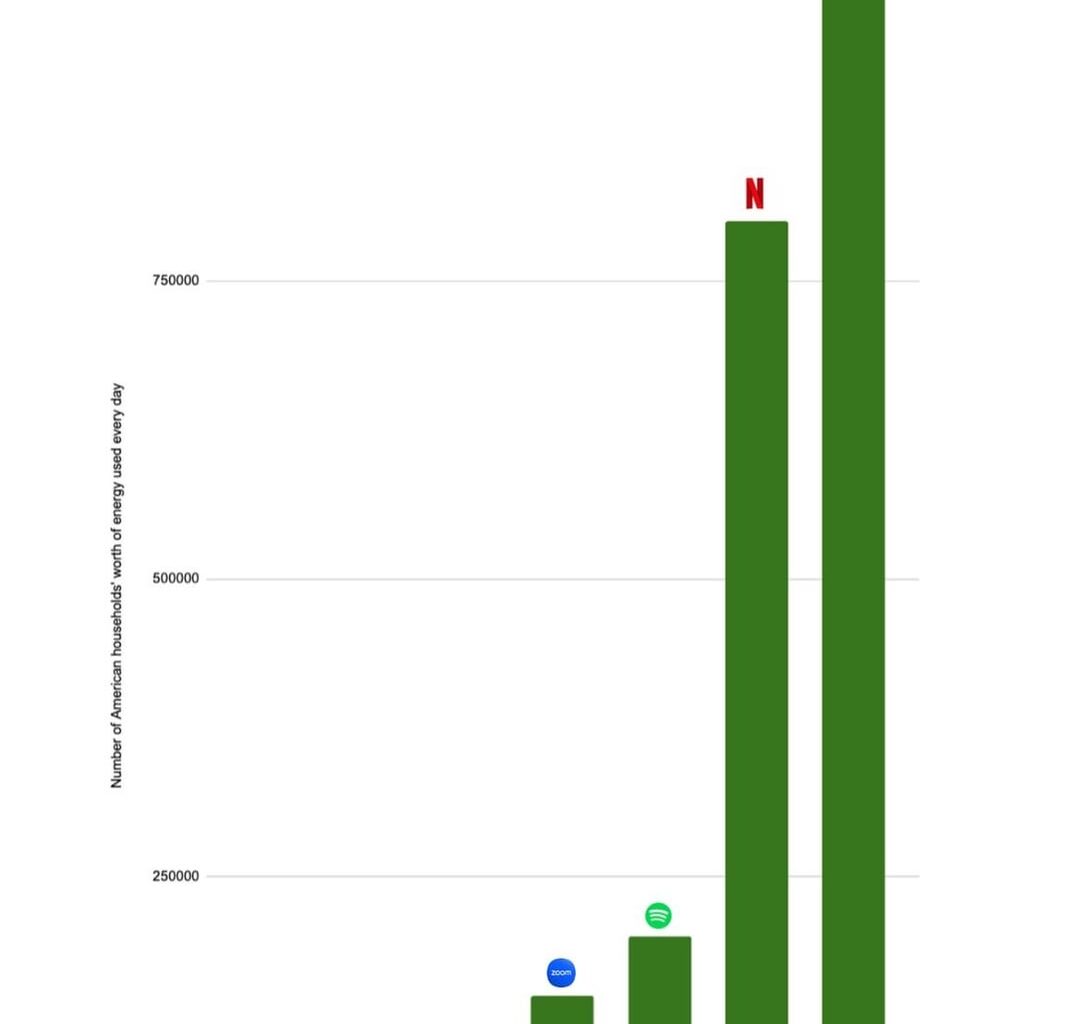
All charts sourced from Andy Masley’s Substack article “Using ChatGPT is not bad for the environment:” https://open.substack.com/pub/andymasley/p/individual-ai-use-is-not-bad-for?r=449ws6&utm_medium=ios
Posted by Interesting-Type3153
5 comments
Strange charts: for some reason the total power consumption is compared, without taking into account usage time and number of users. When I see this, it makes me suspicious of data manipulation.
The third chart, “Asking ChatGPT a question” – does it mean ONE prompt?
Asking a question of chatgpt.
Is like saying loading Google.com.
Yes by itself nearly nothing in comparison to a large video file. Now do it with scale how many 4k videos uploaded in 24 hours vs number of chatgpt calls in 24 uours .
Time and quality matter too.
You know when you see a chart which sets off that little itch in your brain that it’s hiding some bullshit? This is definitely one for me.
good graph, will consult next time i have to choose between taking a transatlantic flight and asking chatgpt 50k questions
This is pure trash. Please delete this shitpost, OP.
Comments are closed.