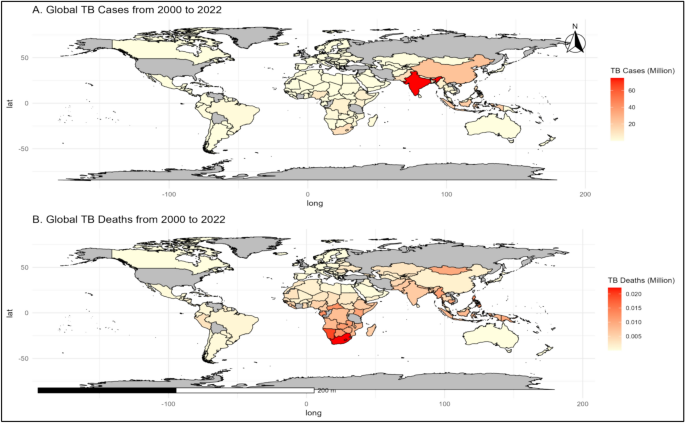
The global trends in TB incidence and mortality from 2000 to 2022 reveal important insights (Fig. 2 and S2). The TB incidence ranged from 20,176 to 29,857 (per 100,000 population), averaging 25,686 (per 100,000 population), with a median of 26,590 (per 100,000 population) (Table 2). Mortality due to TB varied between 2,303 and 3,874 (per 100,000 population), with a mean of 3,059 (per 100,000 population) and a median of 3,016 (per 100,000 population), reflecting notable fluctuations in TB-related deaths over the years (Table 2). The average TB incidence per country ranged from 104 to 153.9 (per 100,000 population), with a mean of 132.4 (per 100,000 population) (Fig. S2, Tables S3-S4). Similarly, the average mortality rate per country varied from 11.87 to 19.97 (per 100,000 population), with a mean of 15.77 (per 100,000 population) (Table 2). Specific country data highlighted that Eswatini had the highest total TB incidence at 22,346 (per 100,000 population), while San Marino had the lowest, with only 12.4 (per 100,000 population). Myanmar reported the highest TB-related total mortality rate of 2,224 (per 100,000 population) over the year 2000–2022, whereas both San Marino and the Democratic People’s Republic of Korea recorded a total mortality rate of 0 (per 100,000 population) (Fig. 1, S2, and Tables S3-S4). Additionally, Myanmar consistently reported a high mortality rate, decreasing from 188 per 100,000 population (2000) to 114 per 100,000 population (2008) (Fig S2 and Table S4). From 2000 to 2022, TB incidence peaked at 29,857 (per 100,000 population) in 2003, while 2020 had the lowest at 20,176 (Fig. 2, S2 Table S3). Over this period, TB incidence and mortality decreased from (29,857 and 3,874) in 2003 to (20,176 and 2,303) in 2022, respectively (Fig S2 and Table S4). Eswatini consistently reported high TB incidence rates, peaking at 1,590 (per 100,000 population) in 2009 and 2010, while Niue and Monaco reported zero cases in several years, indicating varying impacts across regions. From 2020 to 2022, Lesotho reported the highest mortality rates globally, ranging from 600 (per 100,000 population) to 661 (per 100,000 population). In 2020–2021, Timor-Leste recorded high mortality rates of 113 and 116, respectively, whereas in 2022, the highest mortality rate (109 per 100,000 population) was observed in the Marshall Islands (Fig S2 and Table S4).
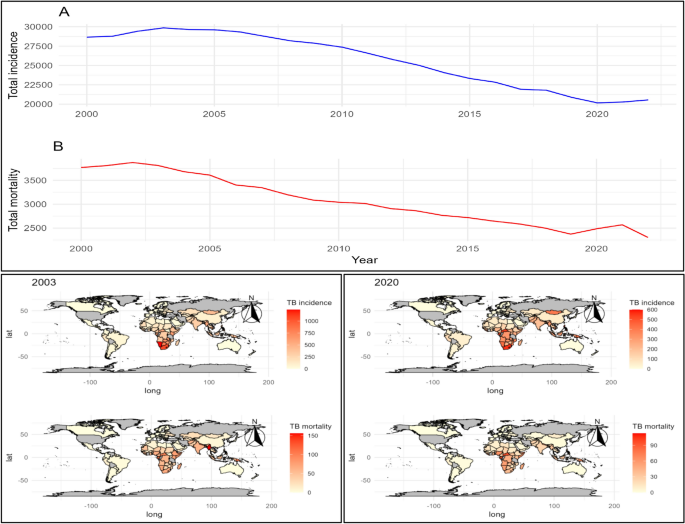
Overview of global TB trends A) TB incidence trends in millions (2000–2022). B) TB mortality trends (2000–2022); 2003: The highest incidence of TB (per 100,000 population); 2020: The lowest incidence of TB (per 100,000 population). The map was created in R (version 4.4.2, https://cran.rstudio.com) using the rnaturalearth package, which provides natural earth map data for visualization. The sf package was used for spatial data handling to ensure accurate representation of geographic boundaries.
Spatial autocorrelation analysis of TB risk factors
The Global Moran’s I analysis reveals critical insights into the spatial distribution of TB determinants (Fig. 3). Key findings demonstrate moderate to high spatial clustering for variables such as the incidence of TB among HIV-positive cases (Moran’s I: 0.534), mortality rate under 5 (per 1000 live births; Moran’s I: 0.288), population growth (Moran’s I: 0.221), and air pollution (Moran’s I: 0.287) (Fig. 3 and Table S4). This clustering indicates the presence of TB incidence or mortality hotspots, underscoring regions where targeted public health interventions could be highly effective. In contrast, factors such as the number of incident TB cases among HIV-positive individuals (Moran’s I: 0.000), age-standardized prevalence of hypertension among adults aged 30 to 79 years (Moran’s I: 0.000), and life expectancy at birth (Moran’s I: 0.000) exhibit no spatial autocorrelation, suggesting a random geographic distribution (Fig. 3 and Table S5).
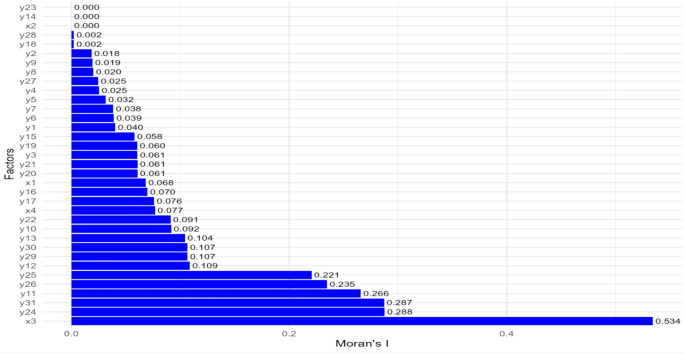
Moran’s I spatial autocorrelation; × 1: Incidence of tuberculosis (per 100,000 population per year); × 2: Number of incident tuberculosis cases (HIV-positive cases); × 3: Incidence of tuberculosis (per 100,000 population) (HIV-positive cases); × 4: Deaths due to tuberculosis among HIV-negative people (per 100,000 population); y1: Treatment success rate for new TB cases; y2: Treatment success rate for previously treated TB cases; y3: Treatment success rate for HIV-positive TB cases; y4: Treatment success rate for patients treated for MDR-TB; y5: Treatment success rate for XDR-TB cases; y6: New cases tested for RR-/MDR-TB (%); y7: Previously treated cases tested for RR-/MDR-TB (%); y8: Confirmed cases of RR-/MDR-TB; y9: Cases started on MDR-TB treatment; y10: TB patients with known HIV status (%); y11: Tested TB patients HIV-positive (%); y12: HIV-positive TB patients on ART (antiretroviral therapy) (%); y13: Prevalence of tobacco use (%); y14: Age-standardized prevalence of hypertension among adults aged 30 to 79 years (%); y15: Most sold brand of cigarettes—retail price in US$ at official exchange rates; y16: Most sold brand of cigarettes—Taxes as a % of price (total tax); y17: Population, total; y18: GDP growth (annual %); y19: Hospital bed density (per 10,000 population); y20: Density of physicians (per 10,000 population); y21: Density of pharmaceutical personnel (per 10,000 population); y22: Domestic general government health expenditure (%); y23: Life expectancy at birth (years); y24: Mortality rate under 5 per 1000 live births; y25: Population growth (annual %); y26: Access to electricity; y27: Land area (sq. km); y28: Arable land (% of land area); y29: Agricultural land (% of land area); y30: Forest area (% of land area); y31: Air pollution.
The Global Moran’s I analysis of TB incidence across three years (2020–2022), with values of 0.582, 0.559, and 0.532 respectively (Table S6). The spatial autocorrelation analysis of TB incidence from 2020–2022 further highlights significant clustering across several regions. (Fig. S3 and Table S7). Lesotho recorded Local Moran’s I values of 13.033 (2020) and 10.505 (2022), with p-values
Correlation between TB incidence and various risk factors
The correlation analysis of TB determinants reveals detailed interrelationships (Fig. S4 and Table S8). A strong positive correlation exists between TB incidence (HIV-positive cases) and TB incidence (per 100,000 population) (r = 0.83) and between confirmed RR-/MDR-TB cases and those started on MDR-TB treatment (r = 0.97). Negative correlations are observed between TB incidence (per 100,000 population) and access to electricity (r = − 0.50), indicating potential socioeconomic disparities. The prevalence of tobacco use shows a moderate negative correlation with life expectancy at birth (r = − 0.31), highlighting the impact of lifestyle factors on health outcomes (Fig. S4 and Table S8).
Selection of the best model
The XGBoost model emerges as the top performer, exhibiting the lowest RMSE (0.88), the highest R2 (0.67), and adjusted R2 (0.65), indicating a superior fit for the data (Fig. S3). In contrast, the Naive model shows the poorest performance, with the highest RMSE (1.56) and the lowest R2 (− 0.03), demonstrating its inability to capture the underlying patterns effectively. The DT and GLM models have comparable performance, with RMSE values of 1.05 and 1.08, respectively, and moderate R2 values. The LightGBM, with an RMSE of 0.91, performs slightly worse than XGBoost but remains competitive. The SVM model, while effective, has an RMSE of 1.00, reflecting slightly lower accuracy than the top models. Overall, XGBoost is identified as the best model for predicting the target variable, showcasing superior performance across all evaluation metrics (Table 3 and Fig. S5).
Factors influencing TB treatment and HIV-related TB
The treatment success rate for new TB cases suggests a moderate positive contribution to TB incidence prediction (SHAP = 0.123). Conversely, the treatment success rate for previously treated TB cases (SHAP = − 0.074) and the success rate for XDR-TB cases (SHAP = − 0.015) show negative contribution to TB incidence prediction. The confirmed cases of MDR-TB have the strongest positive impact (SHAP = 0.874) to predict the TB incidence. Other variables, such as the percentage of TB patients with known HIV status and HIV-positive TB patients on ART (SHAP = 0.053–0.245), also contribute notably to the model’s prediction (Fig. 4 and Tables S9, S10). The SHAP contributions for TB treatment and HIV-related factors vary across different countries in relation to the TB incidence predictions. High contributions are observed in Angola (SHAP = 0.03), Botswana (SHAP = 0.06), Myanmar (SHAP = 0.09), and Namibia (SHAP = 0.08). Medium contributions are noted in Afghanistan (SHAP = 0.02), Bangladesh (SHAP = 0.05), Kenya (SHAP = 0.06), and Zimbabwe (SHAP = 0.06). Minimal contributions are found in Argentina (SHAP = 0.01), Bolivia (SHAP = − 0.05), Chile (SHAP = − 0.07), and Colombia (SHAP = − 0.01) (Fig. 5 and Table S11).
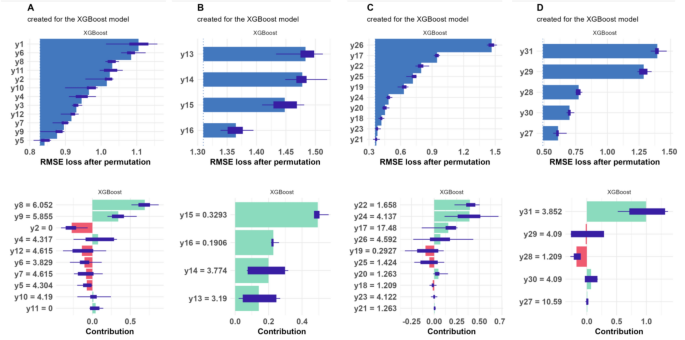
Feature important of A) TB treatment and HIV-related TB factors, B) Health risk factors, C) Socio-demographic and economic factors, D) Environmental and land use factors, E) overall factors. × 1: Incidence of tuberculosis (per 100,000 population per year); × 2: Number of incident tuberculosis cases (HIV-positive cases); × 3: Incidence of tuberculosis (per 100,000 population) (HIV-positive cases); × 4: Deaths due to tuberculosis among HIV-negative people (per 100,000 population); y1: Treatment success rate for new TB cases; y2: Treatment success rate for previously treated TB cases; y3: Treatment success rate for HIV-positive TB cases; y4: Treatment success rate for patients treated for MDR-TB; y5: Treatment success rate for XDR-TB cases; y6: New cases tested for RR-/MDR-TB (%); y7: Previously treated cases tested for RR-/MDR-TB (%); y8: Confirmed cases of RR-/MDR-TB; y9: Cases started on MDR-TB treatment; y10: TB patients with known HIV status (%); y11: Tested TB patients HIV-positive (%); y12: HIV-positive TB patients on ART (antiretroviral therapy) (%); y13: Prevalence of tobacco use (%); y14: Age-standardized prevalence of hypertension among adults aged 30 to 79 years (%); y15: Most sold brand of cigarettes—retail price in US$ at official exchange rates; y16: Most sold brand of cigarettes—Taxes as a % of price (total tax); y17: Population, total; y18: GDP growth (annual %); y19: Hospital bed density (per 10,000 population); y20: Density of physicians (per 10,000 population); y21: Density of pharmaceutical personnel (per 10,000 population); y22: Domestic general government health expenditure (%); y23: Life expectancy at birth (years); y24: Mortality rate under 5 per 1000 live births; y25: Population growth (annual %); y26: Access to electricity; y27: Land area (sq. km); y28: Arable land (% of land area); y29: Agricultural land (% of land area); y30: Forest area (% of land area); y31: Air pollution.
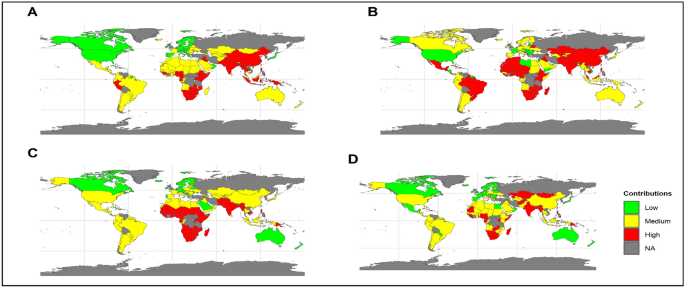
Global mean SHAP contribution of A) TB treatment and HIV-related TB factors, B) Health risk factors, C) Socio-demographic and economic factors, D) Environmental and land use factors. The map was created in R (version 4.4.2, https://cran.rstudio.com) using the rnaturalearth package, which provides natural earth map data for visualization. The sf package was used for spatial data handling to ensure accurate representation of geographic boundaries.
Health risk factors of TB
Health risk factors like tobacco use, hypertension prevalence, and cigarette prices influence TB outcomes. The consumption of tobacco is significantly associated with an increased risk of the disease (SHAP = 0.269). Hypertension prevalence (SHAP = 0.318) and cigarette prices (SHAP = 0.559) also contribute positively to the model, albeit to a lesser extent. Taxes on cigarette prices exhibit their moderate influence on the model’s predictions of TB risks (SHAP = − 0.23 to 0.18) (Fig. 4 and Tables S9, S10). Health risk factors exhibit varied SHAP contributions across countries in relation to TB incidence predictions. High contributions are observed in Afghanistan (SHAP = 0.16), Bhutan (SHAP = − 0.20), Central African Republic (SHAP = − 0.06), and Myanmar (SHAP = 0.02). Medium contributions are noted in Albania (SHAP = 0.13), Benin (SHAP = 0.13), Botswana (SHAP = 0.13), and Burundi (SHAP = 0.18). Minimal contributions are identified in Armenia (SHAP = 0.09), Bahrain (SHAP = − 0.02), Canada (SHAP = − 0.02), and China (SHAP = 0.09) (Fig. 5, Table S11).
Socio-demographic and economic factors of TB
Socio-demographic and economic factors are vital in determining TB incidence and treatment success. The density of pharmaceutical personnel (SHAP = 0.017), life expectancy at birth (SHAP = 0.503), and mortality rate under 5 years (SHAP = 0.710) exhibit strong positive contributions for TB risk. Notably, life expectancy at birth has a significant impact on the TB incidence predictions The contribution of GDP growth, population growth, and access to electricity highlights their notable influence on TB outcomes (SHAP = − 0.23 to 0.433) (Fig. 4 and Tables S9, S10). Countries such as Angola (SHAP = 0.15), Botswana (SHAP = 0.16), Myanmar (SHAP = 0.18), and Namibia (SHAP = 0.5) exhibit high contributions of the Socio-demographic and economic factors in predicting TB incidence. Medium contributions of the factors in predicting TB incidence include Afghanistan (SHAP = 0.1), Bangladesh (SHAP = 0.09), Belize (SHAP = 0.43), and Burkina Faso (SHAP = 0.13). Minimal contributions of the factors in predicting TB incidence are seen in Albania (SHAP = − 0.05), Belgium (SHAP = − 0.12), Bolivia (SHAP = − 0.09), and Bosnia and Herzegovina (SHAP = − 0.09) (Fig. 5 and Table S11).
Environmental and land use factors of TB
Environmental and land use factors, such as land area, arable land percentage, and air pollution, show varying contributions in TB incidence predictions. Air pollution is particularly notable with a strong positive contribution to predict the TB incidence (SHAP = 1.36). Other environmental factors, including land area (SHAP = 0.021) and agricultural land percentage (SHAP = 0.283), also have smaller but notable contributions on it (Fig. 4 and Tables S9, S10). Environmental and land use factors exhibit substantial influence on TB incidence across different countries. High contributions are observed in Afghanistan (SHAP = 0.19), Bangladesh (SHAP = 0.29), Botswana (SHAP = 0.21), and Myanmar (SHAP = 0.27). Medium contributions include Bangladesh (SHAP = 0.29), Botswana (SHAP = 0.21), Benin (SHAP = 0.13), and Ethiopia (SHAP = 0.12). Minimal contributions are found in Albania (SHAP = − 0.07), Belgium (SHAP = − 0.18), Bolivia (SHAP = 0.04), and Bosnia and Herzegovina (SHAP = 0.04) (Fig. 5 and Table S11).
Predictive accuracy and trend analysis of TB incidence
A comparison of predicted and actual TB incidence rates from 2020 to 2022 shows great predictive accuracy, with a high correlation (r = 0.85) and (r2 = 0.72) (Fig. 6). Notably, nations such as Lesotho, South Africa, and Papua New Guinea had mean anticipated occurrences that nearly matched actual incidences, showing good prediction accuracy (Fig. 6 and Table S12).

A) Mean actual TB incidence B) Mean predicted TB incidence C) Trend analysis of TB incidence for each country from 2023 to 2030. The map was created in R (version 4.4.2, https://cran.rstudio.com) using the rnaturalearth package, which provides natural earth map data for visualization. The sf package was used for spatial data handling to ensure accurate representation of geographic boundaries.
The trend exploration from 2023 to 2030 predicts varied patterns of TB incidence among nations (Fig. 6 and S6). Certain nations, notably Albania, Armenia, and Botswana, are expected to see an increase in TB incidence. Botswana is projected to have a total average TB incidence of 533.8 (95% CI: 505.4–562.2) (Table S14). In contrast, nations such as Belize, Cambodia, and Namibia are expected to witness a decline in TB incidence (Fig. 6, S6 and Table S13). Cambodia is predicted to have a total average incidence of 398.3 (95% CI: 382.9–413.8), while Namibia is expected to have an average incidence of 823.1 (95% CI: 780.7–865.6) (Table S14).