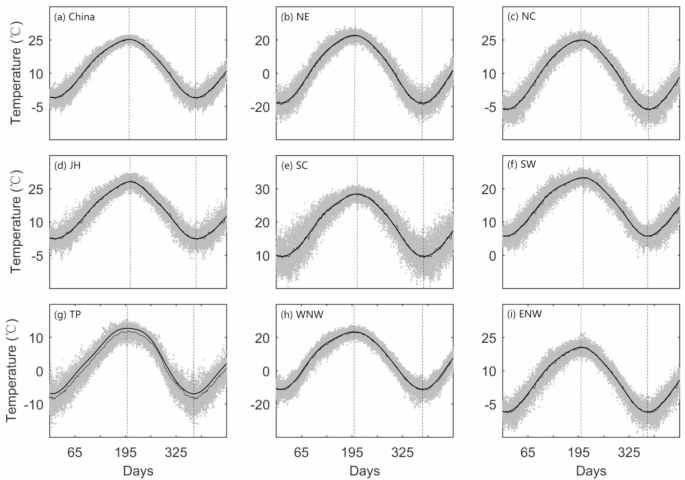
The regional mean surface air temperature from gauge observation during 1961 –2014. The dots show the regional mean daily temperature for every year from 1961 to 2014. The thin black lines show the climatological mean for each calendar day, and the thick black line shows the Fourier transform of the data. The vertical dashed red and blue lines show the location of phase-max and phase-min after Fourier smoothing.
The climatological mean temperature annual cycle for each region from gauge observation during 1961 − 2014 is shown in Fig. 2. The observed regional mean daily temperature for every year from 1961 to 2014, and their climatological mean for each calendar day are also shown for comparison. It illustrates that, the surface air temperature exhibits apparent seasonal change in these extra-tropics, forced by the seasonal insolation cycle. However, the observed temperature shows obvious fluctuation, which mainly due to the impacts at synoptic scale. This high frequency fluctuation can be nearly filtered out and only the signal of seasonal transition is remained in the temperature annual cycle after the Fourier smoothing. This annual cycle of surface air temperature is nearly sinusoidal for all regions, and therefore can be characterized by phase and amplitude, representing the position of the maximum temperature and the annual temperature range respectively. In additional, there is a large difference between the climatological mean and the Fourier transform of the data over TP region (Fig. 2g). This may due to the insufficient sampling frequency in the original data, which can result in the loss of some information and cause deviations in the Fourier smoothing.
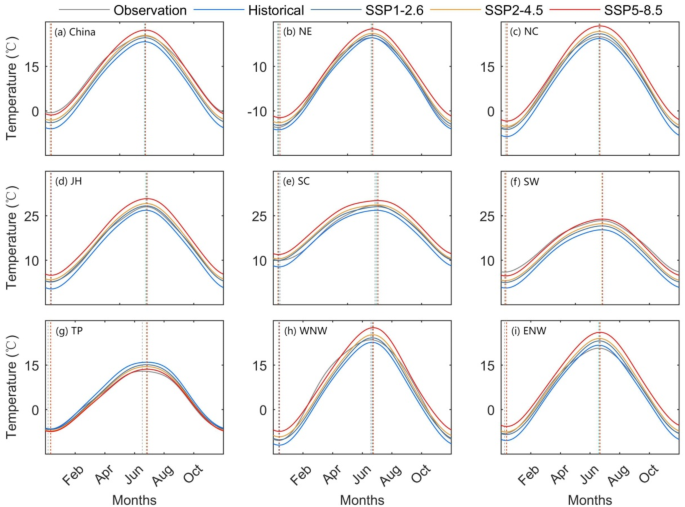
Annual temperature cycles from a Fourier smoothing of the CMIP monthly average temperature in China under three future scenarios: SSP1-2.6, SSP2-4.5, and SSP5-8.5 for the selected future time periods (2071–2010). The historical simulation and gauge observations for the selected reference periods (1981–2010) are also shown. The vertical dotted lines represent the phase-max and phase-min, respectively.
The spatial distribution of temperature climatology for historical period is shown in the Figure S1 of the supplementary material. It is found that, most of the models can capture the temperature climatology, and there are obvious hierarchical confidence characteristics. In the eastern monsoon area with dense stations, all the CMIP6 models showed high simulation accuracy. However, most of them have large errors in the arid WNW, ENW and TP regions with sparse observation stations, indicating that the simulation deviation of CMIP6 in these regions may be caused by insufficient constraints of CMIP6 models for micro-meteorological processes in complex terrain. Specifically, the models CAMS-CSM1-0 and MRI-ESM2-0 maintained good performance in every region, while MIROC6 and MIROC-ES2L showed considerable deviations in most regions. It is worth noting that the multi-model ensemble mean (MME) had quite small deviation within each region, indicating that the integrated multi-model results have high robustness.
Figure 3 shows that the phase-max and phase-min were quite similar for the temperature annual cycle from historical simulation and gauge observation, as well as those under the different development scenarios. This indicates that the CMIP6 model can accurately reproduce the annual cycle between summer and winter, although it may imply that the models may share some common discrepancies. The maximum differences between the future and historical annual cycles of surface air temperature were observed in the simulation using the SSP5-8.5 scenario, which is 202.8 and 11.9 days for the phase-max and phase-min, contrasting to 200.6 and 10.9 days in the historical results, respectively. The amplitudes of the annual cycle were larger for the future scenarios than for the simulations for historical periods and from gauge observations. This indicates the different changes between the summer and winter, accompanied with an asymmetry in the warming rate of the annual minimum and maximum temperatures in the future scenarios. It probably because a continuous increase in latent heat flux and the resulting strong surface evaporative cooling will result in a weaker surface air temperature warming in summer than in winter.
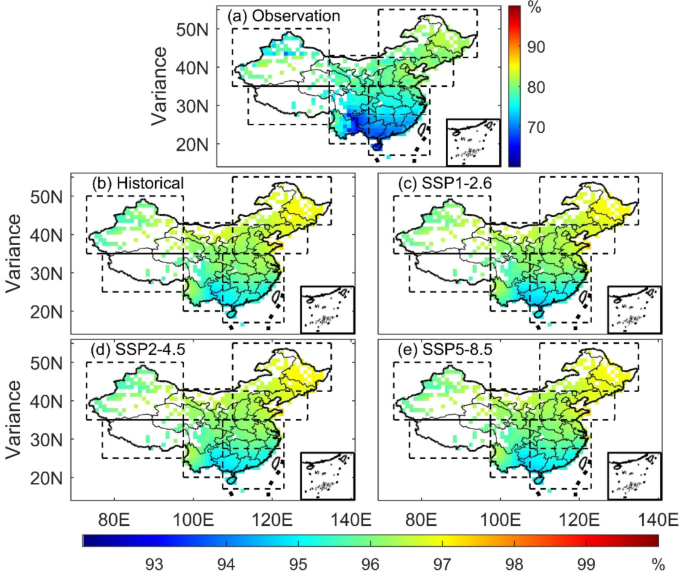
The interpretable variance of the Fourier smoothing in each effective grid using gauge observations, the historical monthly temperature, and under the three future shared socioeconomic pathways of CMIP6: (a) gauge observation, (b) historical data, (c) SSP1-2.6, (d) SSP2-4.5, and (e) SSP5-8.5. The map is created using MATLAB 2023b (https://ww2.mathworks.cn/downloads/).
To reveal the feasibility of the Fourier smoothing, the capacity of this method for capturing the annual cycle of surface air temperature was quantified using the interpretable variance (Fig. 4). For the historical temperature data, the interpretable variance is between 94.7% and 97.3% for all the 618 grids (averaged as 96.2%), while it is between 94.6% and 97.8% (averaged as 96.3%) under the three future scenarios. Therefore, the Fourier smoothing method can explain most of the variance in the temperature series, indicating that temperature changes are dominated by seasonal fluctuations, for both historical data and future projected scenarios. Spatially, the interpretation rate was relatively low in some grids in the SW region, because the annual cycle of surface air temperature near the Tropic of Cancer was very different from the trigonometric function with a single peak. Overall, the Fourier smoothing method could effectively describe the annual cycle of the monthly temperature series, thereby obtaining reliable amplitudes and phases of the annual cycle of surface air temperature in China.
The long-term phase and amplitude trends
To characterize the interannual climate patterns, the long-term changes and related trends of the phase-max, phase-min, and amplitude under the three future scenarios are shown in Fig. 5, as well as the gauge observations and CMIP6 historical data from 1961 to 2014. The phase displays an upward trend in the 21st century, with the phase-max having a larger increase compared to the phase-min (Fig. 5a and b), and the amplitude slightly decreases (Fig. 5c). The phase-max trends were 0.11, 0.12, and 0.36 days/10 years under the SSP1-2.6, SSP2-4.5, and SSP5-8.5 scenarios, respectively, which contrasted with the values of 0.23 days/10 years in the historical simulation and − 0.51 days/10 years from gauge observations. Additionally, the phase-max standard deviation in the future scenario was larger than in the historical data, indicating that the volatility and uncertainty of temperature annual cycles will also increase under future global warming.
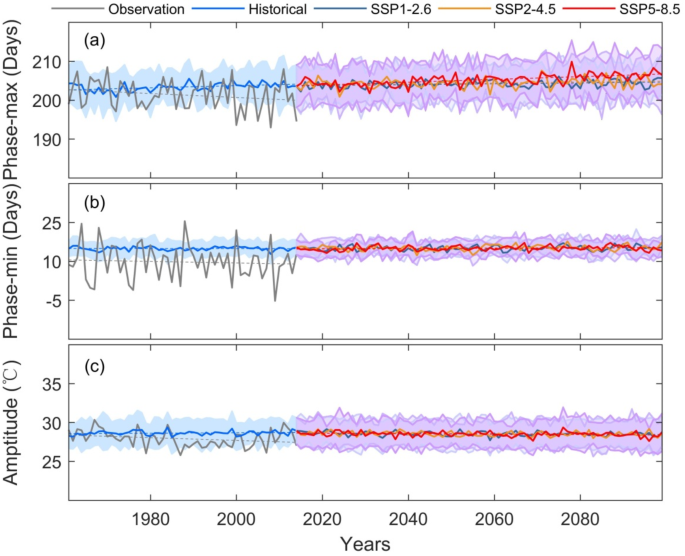
Time series of the phase-max, phase-min, and amplitude from the CMIP6 future scenarios: SSP1-2.6, SSP2-4.5, and SSP5-8.5. The historical simulation and gauge observations are also displayed. The shadows represent one standard deviation from the multiyear average.
Compared to the significantly increasing phase-max trend, the phase-min trend had a smaller slope (Fig. 5b). They were 0.04, 0.04, and 0.06 days/10 years from CMIP6 data for the three future scenarios, respectively, contrasting with the values of -0.01 days/10 years in the historical simulation and − 0.30 days/10 years from gauge observations. The trends under all the scenarios passed the significance test at the 0.05 level. The standard deviation range in the future scenario was comparable with the historical CMIP6 data, and there were no significant differences.
The national average amplitude data obtained from CMIP6 future scenario data was basically consistent with historical data, and was higher than the amplitude value calculated from gauge observations (Fig. 5c). The amplitude trends of CMIP6 obtained through Fourier smoothing for three future scenarios were − 0.02, -0.03, and − 0.03 °C/10 years, respectively contrasting with the values of 0.03 °C /10 years in the historical simulation and − 0.18 °C/10 years from gauge observations. The trends under the SSP2-4.5 and SSP5-8.5 scenarios passed the significance test at the 0.05 level, and the trends under the SSP1-2.6 scenarios passed the significance test at the 0.10 level. The amplitude changes are closely related to the seasonal differences in surface warming caused by changes in the surface energy flux. The increase in the latent heat flux in summer (evaporative cooling) has a stronger inhibitory effect on surface air warming than in winter, could result in a decreasing trend of amplitude changes in China45. Additionally, the impact of human factors on the temperature annual cycle in China cannot be ignored46,47.
The changes of phase and amplitude obtained from Fourier smoothing of the CMIP6 temperature data for the three future scenarios in the eight regions in this study were shown in Figures S2 − S9. There were significant differences between the amplitude and phase obtained from the future CMIP6 data and gauge observations. This may be due to systematic errors in the simulation of temperature in the models. The long-term amplitude trends under the future scenario in the NE, NC, SC and SW regions decreased, which was very different from the trends obtained in other regions (Figure S2, S3, S5, S6). This was related to the asymmetric warming in these regions in the future scenario. Specifically, there was a very clear warming trend in the NE region, and the degree of warming in winter and long-term trends were significantly higher than in summer. Therefore, in the CMIP6 mode simulation, the long-term amplitude trend decreases.
Spatial patterns of the long-term trends
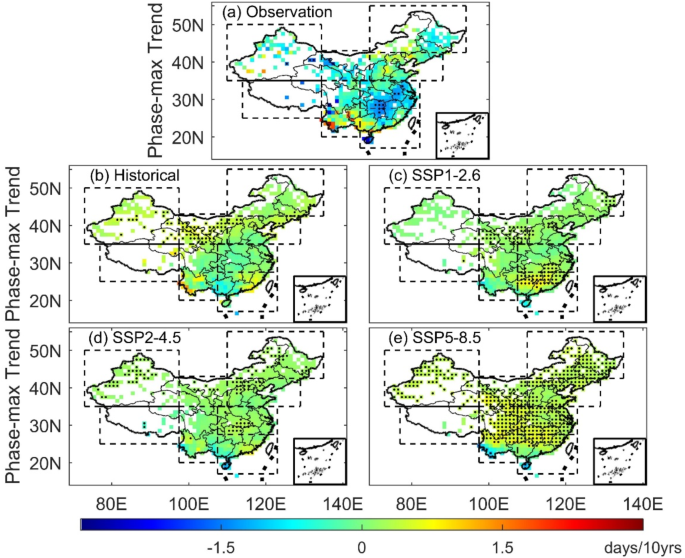
The long-term phase-max trend on each effective grid using gauge observation, the historical monthly temperature and three future shared socioeconomic pathways of CMIP6: (a) gauge observation, (b) historical data, (c) SSP1-2.6, (d) SSP2-4.5, and (e) SSP5-8.5. The black dots in the grid indicate that the long-term trend passed the significance test at the 0.05 level for that grid. The map is created using MATLAB 2023b (https://ww2.mathworks.cn/downloads/).
For the long-term phase-max trends, both historical data and the three future scenarios produced a relatively consistent spatial pattern, with an increasing trend throughout the entire region of China (Fig. 6). For the SSP1-2.6 and SSP2-4.5 scenarios, the grids that passed the significance test were mainly concentrated in the NC, SC and ENW regions, while most grids passed the significance test at the 0.05 level for the SSP5-8.5 scenario, except some of the SW region (Fig. 6c and d). This indicates that the trend of phase-max in the future scenario was robust, and it may result in a longer summer season and more extreme high temperature events in the future. There was an obvious north-south gradient in the study area for the trend of phase-max, with a gradual decrease from north to south. For the southwest region, there was an opposite decreasing phase-max trend compared to most parts of the country. The surface energy balance may play an important role on the temperature annual cycle. Previous studies have shown that, the downward longwave radiation flux (sensible and latent heat flux) largely determines the surface energy balance during winter (summer). The convective precipitation and evaporation processes also have impacts on the regional differences48,49.
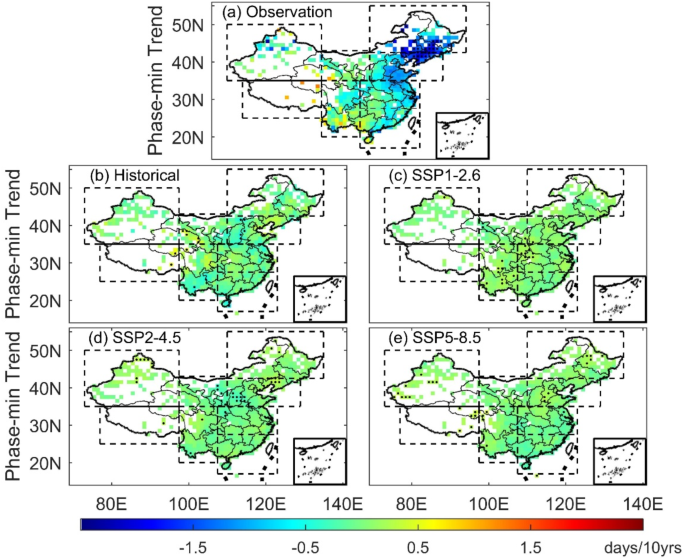
The long-term phase-min trend in each effective grids using gauge observation, the historical monthly temperature and three future shared socioeconomic pathways of CMIP6: (a) gauge observation, (b) historical data, (c) SSP1-2.6, (d) SSP2-4.5, and (e) SSP5-8.5. The black dots in the grid indicate that the long-term trend has passed the significance test at the 0.05 level for that grid. The map is created using MATLAB 2023b (https://ww2.mathworks.cn/downloads/).
For the phase-min, there was a significant difference in the long-term trend between the observation and the three future scenarios (Fig. 7). For historical temperature data, there was a clear decreasing trend in the NC, JH and SW regions of China, while there was an increasing trend in other regions. The long-term minimum phase trend obtained from the three future emission scenarios displayed a lag in most regions of the study area (Fig. 7c, d and e). This may result in a shorter winter season and less extreme high temperature events in the future. Overall, there were few grids that passed the significance test, indicating that the long-term phase-min trend obtained from the Fourier smoothing of CMIP6 future data was not robust.
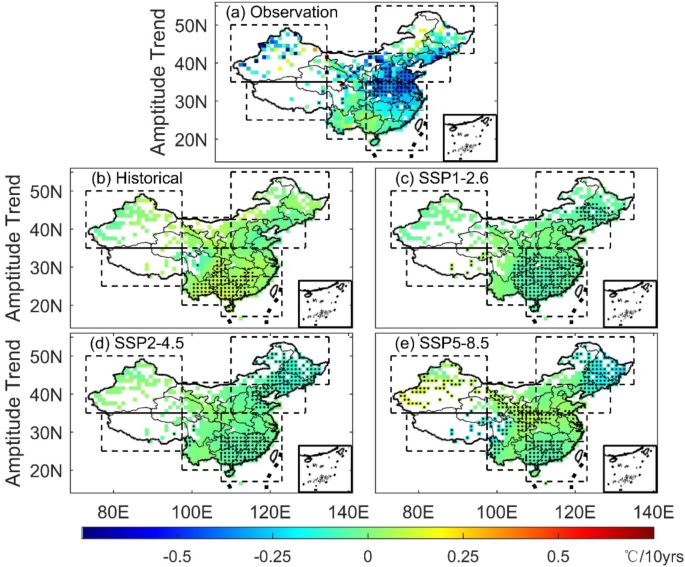
The long-term amplitude trend in each effective grid using gauge observations, the historical monthly temperature and three future shared socioeconomic pathways of CMIP6: (a) gauge observation, (b) historical data, (c) SSP1-2.6, (d) SSP2-4.5, and (e) SSP5-8.5. The black dots in the grid indicate that the long-term trend passed the significance test at the 0.05 level for that grid. The map is created using MATLAB 2023b (https://ww2.mathworks.cn/downloads/).
The long-term amplitude trend displayed a large spatial heterogeneity obtained from the Fourier smoothing of historical temperature data and three future scenarios (Fig. 8). The historical data showed an increasing trend in amplitude throughout the entire study area of China, with an average value of 0.03 °C/10 years, and showed a spatial pattern that gradually increased from the northeast to southwest regions. For the SSP1-2.6 scenario, the regional amplitude trends were relatively close, with a slight decrease in the areas south of the Qinling and Huaihe Rivers, as well as in NE (Fig. 8c). Most of the long-term trends in these areas passed the significance test at the 0.05 level. The spatial patterns of the trends in the SSP2-4.5 and SSP5-8.5 scenarios were similar (Fig. 8c and d), and there was a significant trend reduction in the NE region, with most of the grids passing the significance test at the 0.05 level, which was mainly manifested as an increased trend in other regions. This results in the decreasing of the annual temperature range in the high latitudes, such as NE regions, which may lead to an extension of the growing season.
Seasonal differences in temperature changes
The amplitude of the annual cycle of surface air temperature obtained from the Fourier smoothing of CMIP6 under the three future shared socioeconomic pathways exhibited extremely large increasing or decreasing trends in some regions. To detect the reasons, the average monthly temperature data were calculated during the historical period of CMIP6 and under the three shared socioeconomic pathways in the future. Figure 9 shows the time series of monthly anomalies of the temperature differences between January and July in the study area and in eight selected regions, which were obtained by subtracting the multi-year means during the period of 1961 –2014. Compared to January and July in the historical period, the monthly average temperature anomaly of the three future shared socioeconomic pathways exhibited a significant upward trend in the national and all the selected regions except WNW. Moreover, the temperature anomaly under the SSP5-8.5 scenario exhibited a very significant increasing trend in this century (Fig. 9). This indicates that under the scenario with high development emissions, global warming will be intensified accordingly.
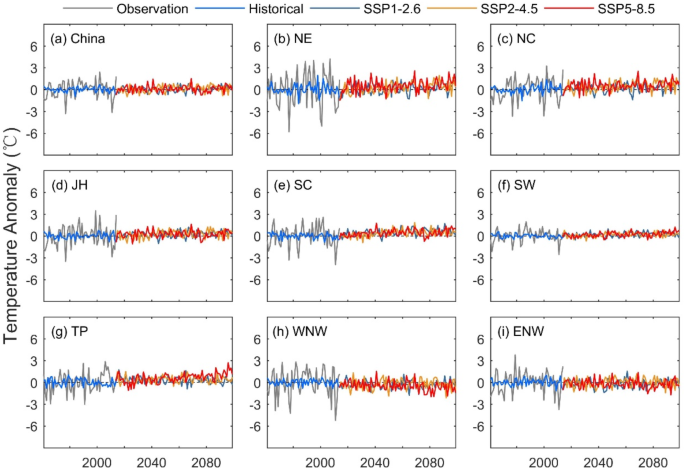
The time series of the regional mean of the anomaly of the monthly temperature differences between January and July in the study area and eight selected regions. The three future shared socioeconomic pathways of CMIP6 were: SSP1-2.6, SSP2-4.5, and SSP5-8.5. The historical simulation and gauge observations are also displayed.
The temperature anomaly trend in NE, WNW, ENW and NC was greater than that in SW and SC, especially under the SSP5-8.5 scenario. This difference illustrated the spatial heterogeneity of global warming, i.e. the temperature increasing was more pronounced in high latitude regions than in low latitude regions. Previous study have also demonstrated that warming was found to be the greatest in winter, and the intrayear variability of temperature showed obvious latitudinal differences over China50. The temperature of January increased greater than that of July in the NE region, especially under the SSP5-8.5 scenario, while the temperature anomaly in the WNW region under this scenario displayed the opposite change. The asymmetric increasing trends between January and July indicated that the long-term trend amplitude under the future scenarios of CMIP6 in these two regions increased and decreased, respectively. Therefore, there were large differences in the long-term trends and spatial patterns of amplitude and phase under the different future scenarios, and the CMIP6 model still have significant errors in simulating the variables that described the annual cycle of surface air temperature.
Comparison of model differences under the future scenarios
The performances of the various models were further compared in terms of the differences in long-term phase and amplitude trends for the historical data and under the three future scenarios of CMIP6. The phase-max, phase-min, and amplitude trends for each of the 13 climate models were determined using historical data and under the three future scenarios (SSP1-2.6, SSP2-4.5, and SSP5-8.5) after a Fourier smoothing. For the phase-max, the multi-model ensemble mean (MME) showed an increasing long-term trend (Fig. 10a), where the trend under the future scenarios SSP5-8.5 passed the significance test at the 0.01 level. Some of them exhibited decreasing long-term phase-max trends, which may be related to the differences in monthly average temperature calculated among the various CMIP6 Earth system models.
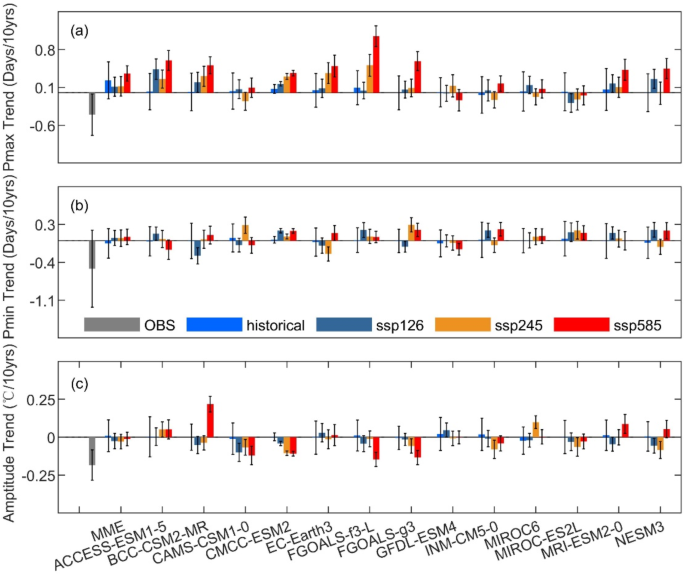
The long-term phase-max, phase-min, and amplitude trends obtained from a Fourier smoothing of monthly average temperatures from gauge observations, and 13 CMIP6 models using historical data and under three future scenarios: SSP1-2.6, SSP2-4.5, and SSP5-8.5. MME represents multi-model ensemble mean results. The bars represent for the uncertainty ranges under the 95% significant test.
The MME of CMIP6 historical data showed an advancing long-term trend for the phase-min, while under the future three scenarios there was a delayed trend (Fig. 10b). These trends did not pass the significance test, indicating that there was large uncertainty in the phase-min of the annual cycle of surface air temperature in China. The results of MME were less pronounced than the observation, since the different simulation could be canceled out for the model averages. Most of the long-term trends from these models did not pass the significance test, except for BCC-CSM2-MR, CMCC-ESM2, FGOALS-g3, FGOALS-f3-L and MRI-ESM2-0 under SSP1-2.6, CMCC-ESM2, FGOALS-g3 and MIROC-ES2L under SSP2-4.5, and CMCC-ESM2, FGOALS-g3, GFDL-ESM4, INM-CM5-0 and MIROC-ES2L under SSP5-8.5, all of which passed the significance test at the 0.05 level.
The long-term amplitude trends obtained from a Fourier smoothing of CMIP6 historical data and the future scenarios in China were consistent among all models. The MME of CMIP6 historical data showed an advancing long-term trend, while the future three scenarios showed a delayed trend (Fig. 10c). However, none of these trends passed the significance test, indicating that there was also large uncertainty in the amplitude of the annual cycle of surface air temperature in China. The trends for all models under the future scenarios showed a consistent decreasing trend with the MME. Additionally, the trend of BCC-CSM2-MR under the SSP5-8.5 scenario passed the significance test at the 0.01 level (0.22 °C/10 years).The trends of the CAMS-CSM1-0, CMCC-ESM3, FGOALS-f3-L and FGOALS-g3 models under the SSP5-8.5 scenario passed the significant test at the 0.05 level, with values of -0.12, -0.11, -0.15 and − 0.13 °C/10 years, respectively. It was inferred that there were large differences in the performances of the CMIP6 models in determining the trend of the annual cycle of surface air temperature in China in the future. Therefore, the CMIP6 temperature data still has large room for improvement in characterizing changes in the annual cycle of regional temperature.