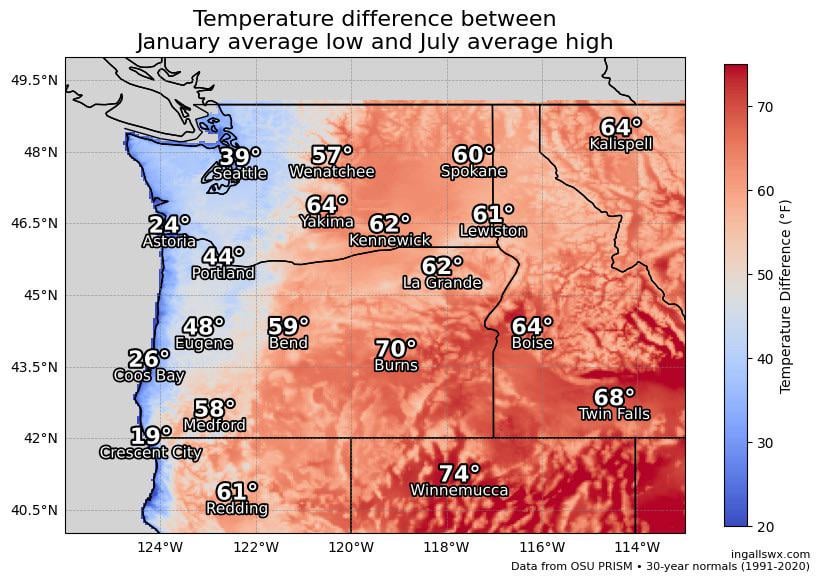
The source is the Oregon State University PRISM Climate Group 30-year normals spanning 1991-2020. The selected parameters are January minimum temperature and July maximum temperature.
Map created in a Jupyter Notebook using the following Python libraries: numpy, rasterio, matplotlib, cartopy
Posted by DJCane
9 comments
The source is the [Oregon State University PRISM Climate Group](https://www.prism.oregonstate.edu/normals/) 30-year normals spanning 1991-2020. The selected parameters are January minimum temperature and July maximum temperature.
Map created in a Jupyter Notebook using the following Python libraries: numpy, rasterio, matplotlib, cartopy
It’s fun to note that not-quite-coastal mountains often create both a rainforest and a desert.
In this case, its the Vancouver rainforest/PNW and the high desert separated by the cascades.
The Atacama and Amazon are another example, the wettest and driest places in the world outside of Antarctica are actually pretty close, separated by the Andes. This is usually on the west coast but can flip if you get close enough to the poles. South of the Atacama is the Valdivian rainforest, which is not part of the Amazon. Similarly, Patagonia, south of the Amazon and much drier, is not part of the Atacama.
[deleted]
Marine influence also Fades with distance from the ocean. Mountains are only a part of it.
Are you sure it’s not showing the influence of the coast?
I’m curious about this chart with the last twenty years and again with the last ten.
I transferred to the Tri-Cities a while back and got to experience both The BIg Cold and Everything’s on Fire. My dog had to wear booties or she refused to go on walks 🥶🥵
Your map would be better if you labeled the Cascades.
Last summer, my wife and I were on a road trip along the PNW. Along the coast it was 60-65 degrees, cool breezes. When we drove over the mountains it was 95-105 depending on where we were. We crossed the mountains a few times looking for reprieve from the heat.
Comments are closed.