It can be seen from Fig. 5, during the entire combustion stage, CO2 emission concentration was the highest, followed by NO and SO2, and NO2 was the lowest. The average emission concentration of CO2 was relatively stable before the fourth stage, and began to rise significantly from the fifth stage. This was because in the middle stage of combustion, the decomposition and oxidation of the fuel intensified, resulting in a significant increase in CO2 emissions. The average concentrations of SO2 and NO showed a slow increasing trend throughout the combustion process, which may be related to the gradual release and combustion of S and N elements in the biomass fuel. The average concentration of NO2 was the lowest among all pollutants, but its fluctuation range was the largest, indicating that the generation and release of NO2 during biomass combustion was closely related to the properties of the fuel, combustion temperature and redox conditions.
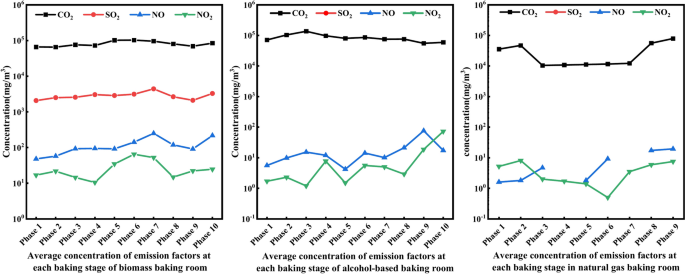
Average concentration of main gas emissions at each stage of curing rooms with different fuels.
Analysis of main gas emission concentrations at each stage of alcohol-based fuel curing room under standard working conditions
It can be seen from the middle of Fig. 5, during the entire combustion stage, CO2 emission concentration was the highest, NO and NO2 were the lowest, and there is no SO2 emission. The average concentration of CO2 was relatively stable during the entire combustion process, indicating that during the combustion of the alcohol base, the oxidation reaction of the carbon element was relatively stable and the amount of CO2 generated will not change significantly. NO and NO2 fluctuated during the combustion process, with the average concentration of NO reaching a minimum of 4.2 mg/m3 in the fifth stage; The average concentration of NO2 fluctuated repeatedly in the first five stages because the combustion conditions changed greatly during this stage, resulting in the suppression of nitrogen oxides. The emission concentrations of NO and NO2 gradually increased from the sixth stage to the tenth stage, indicating that with increasing combustion of the fuel, the oxidation reaction of the N element gradually strengthened, resulting in an increase in the generation of N and O compounds.
Analysis on emission concentration of main gas emissions at each stage of natural gas fuel baking room under standard working conditions
It can be seen from the right of Fig. 5, CO2 emission concentration changes relatively steadily during the entire operation of the curing room, indicating that the natural gas was burned fully. The emission concentration variation trend of NO2 was quite similar to that of CO2. Unlike CO2, the concentration of NO2 reached its minimum value of 0.5 mg/m3 in the sixth stage, which may be due to changes in combustion temperature, oxygen supply and fuel decomposition rate. The NO emission concentration changes relatively steadily during the entire operation of the oven. The NO emission in the fourth and seventh stages was 0 mg/m3, indicating that conditions for the formation of N and O compounds did not met in this stage. The NO concentration in the remaining stages was maintained between [1.6–19.4] mg/m3. During the operation of the natural gas fuel baking room, the generation of NO and NO2 was relatively small. This is because the proportion of O element in the composition of natural gas is 0, resulting in the redox reaction of internal N and O compounds, which requires external O element to proceed.
Analysis of main gas emissions at each stage of curing rooms using different fuelsAnalysis of main gas emissions at each stage of biomass fuel curing room
It can be seen from the left of Fig. 6 thatCO2 emissions experienced obvious fluctuations throughout the process, reaching a peak in the fifth stage, then gradually decreasing, and gradually increasing again after the seventh stage until it reached a value of 541 kg in the tenth stage. The total emission of SO2 and NO showed relatively gentle fluctuations throughout the combustion process. The emission of SO2 and NO gradually reached their peak of 2.678 kg and 0.675 kg in the tenth stage. This is because the release of S and N elements is a relatively slow and continuous process. NO2 emissions are almost negligible in the first six combustion stages, reaching a maximum value of 0.0096 kg in the eighth stage and then gradually decreasing. This is because the generation of NO2 is usually closely related to the combustion conditions and the balance of redox reactions.
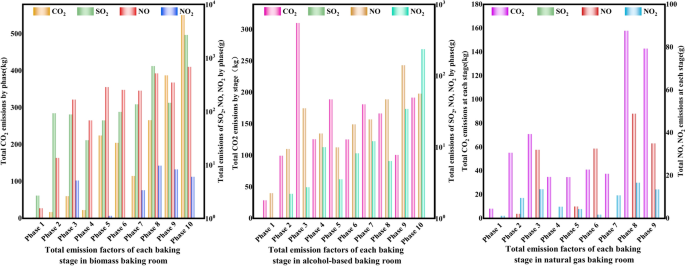
Emissions of main gas emissions at each stage of baking rooms with different fuels.
Analysis on main gaseous emissions at each stage of alcohol-based fuel curing room
It can be seen from the middle of Fig. 6, during the entire combustion stage, CO2 emission concentration was the highest. NO and NO2 were the lowest, and there was no SO2 emission. CO2 emission was relatively stable throughout the combustion process, indicating that during the combustion of alcohol-based products, the amount of CO2 generated will not change significantly due to changes in combustion time or stage. NO and NO2 emissions fluctuate during the combustion process, but the overall trend was upward. There are slight fluctuations in the first five stages, and as combustion continues, the sixth stage begins to increase gradually, indicating that as the fuel burns further, the oxidation reaction of the N element gradually increases, resulting in an increase in the generation of N and O compounds.
Analysis of the emission of main gas emissions at each stage of natural gas fuel baking room
It can be seen from the right of Fig. 6, the emission factors of natural gas fuel baking room gradually increased in the initial stage and reached the first significant peak in the third stage. As the combustion process continues, the total emissions of the emission factor begin to gradually decrease. This trend shows that as the fuel is consumed, the combustion reaction in the drying room gradually stabilizes, and the generation rate of emission factors slows down, resulting in reduced emissions. As the drying room entered the eighth stage of operation, the total emission of emission factors increased significantly again and reached the maximum value of the entire stage, with CO2 emissions of 157.78 kg, NO emissions of 0.0489 kg and NO2 emissions of 0.0167 kg. At this point, the fuel in the drying room may have been nearly completely burned, resulting in an increase in the generation of emission factors.
Comparison of main gas emissions per cubic meter during the baking life cycle of different fuel baking rooms
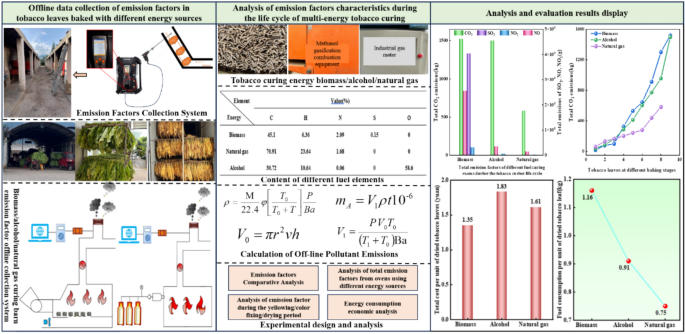
As can be seen from the left of Fig. 7, the total emissions per cubic meter of each emission factor of different energy sources during the tobacco baking life cycle are biomass, alcohol-based, and natural gas from most to least. The highest total emissions of CO2, SO2, NO and NO2 per cubic meter was from biomass, which were 21.1 kg, 0.0567 kg, 0.0361 kg and 0.0005 kg respectively. Specifically, biomass had the most types of emission factors, and the emission of each pollutant is relatively large. This phenomenon is related to the composition of biomass fuel and its combustion process. Total NO2 emissions per cubic meter from alcohol and natural gas were almost zero because the proportion of N and O elements in alcohol and natural gas fuels was very small, so related redox reactions may not occur during the combustion process. As for SO2, since natural gas and alcohol fuels contain zero S element, almost no redox reaction can occur and no SO2 was discharged. Therefore, natural gas and alcohol produce far fewer harmful substances when burned than coal, demonstrating their advantages in reducing air pollution.
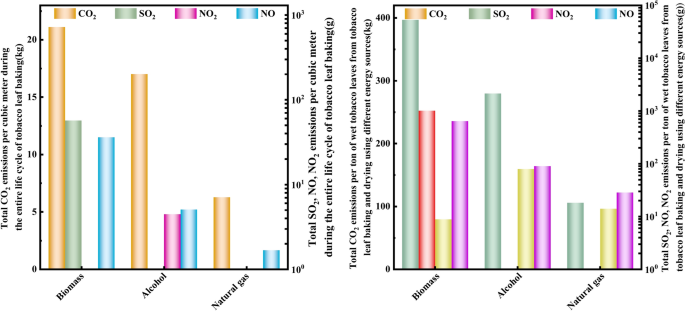
Total emissions per cubic meter of each major gas emission unit during the tobacco leaf curing life cycle in different energy curing rooms (left) Total emissions per ton of wet tobacco leaf (right).
According to Fig. 7 on the right, total CO2 emissions generated per ton of wet tobacco leaves during the baking process in biomass and alcohol fuel barns were 396.67 kg and 279.71 kg, respectively. However, natural gas showed a significant advantage among all fuels, with its CO2 emission of only 105.97 kg per ton of wet tobacco, indicating that the use of natural gas as a fuel has significantly reduced CO2 emissions. The maximum SO2 emission from biomass was 1.008 kg, while the SO2 emission from alcohol and natural gas was 0, because natural gas and alcohol fuels contain 0 S element, so redox reaction can hardly occur. The NO and NO2 emissions of biomass were the highest, which were 0.641 kg and 0.079 kg respectively. Natural gas had no NO and the lowest NO2 emissions because the proportion of O element contained in natural gas fuel was 0, and the NOX produced is caused by the redox reaction with O element in the air.
Analysis of main gas emissions during yellowing, color fixing and rib drying periods in curing rooms with different energy sources
Analysis of CO
2
emissions from different energy curing rooms during the yellowing, color fixing and dry period of tobacco leaves
As shown in the upper left of Fig. 8, the CO2 emission of the bio-roasting room in the tobacco yellowing, color fixation and dry tendon stages was gradually increasing, in which the most CO2 emission in the tobacco dry tendon stage was 892.94 kg, which is mainly due to the long roasting time and high energy usage in this stage. Alcohol based roastery had the highest CO2 emission of 753.09 kg during the yellowing stage of tobacco. natural gas roastery had the highest CO2 emission of 300.53 kg during the dry tendon stage of tobacco.
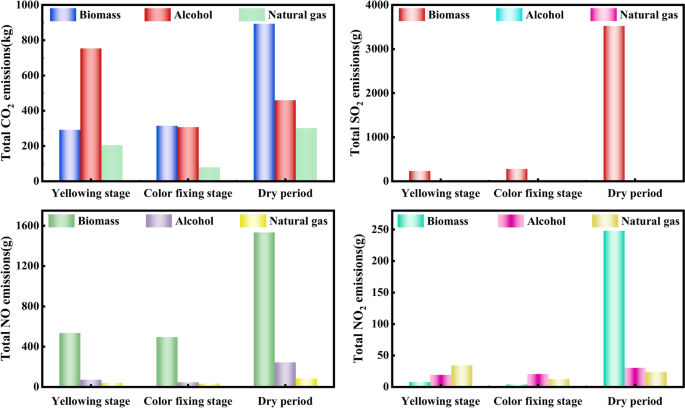
Emissions of CO2, SO2, NO and NO2 in tobacco leaf yellowing, color fixing, and dry period in different energy curing rooms.
Analysis of SO
2
emissions from different energy curing rooms during the yellowing, color fixing and dry period of tobacco leaves
As shown in the upper right corner of Fig. 8, the SO2 emissions from the biomass curing room gradually increased during the tobacco leaf yellowing period, color fixing period and rib drying period, with an increase rate of 16.4% and 92.07% respectively. The maximum SO2 emission during the tobacco leaf rib drying period was 35.23 kg, because the baking time in this stage is long and the drying box requires a high temperature. The fuel used in alcohol and natural gas curing rooms does not contain sulfur element, so these two curing rooms do not emit SO2.
Analysis of NO emissions from different energy curing rooms during the yellowing, color fixing and dry period of tobacco leaves
As shown in the lower left of Fig. 8, the NO emissions from biomass, alcohol and natural gas curing rooms are all the highest during the dry period, at 1.53 kg, 0.242 kg and 0.084 kg, respectively. The NO emissions from alcohol-based and natural gas curing rooms are much less than those from biomass, because alcohol and natural gas contain less N and O elements, and redox reactions cannot fully occur.
Analysis of NO
2
emissions from different energy curing rooms during the yellowing, color fixing and dry period of tobacco leaves
As shown in the lower right corner of Fig. 8, the biomass and alcohol curing rooms had the highest NO2 emissions during the tobacco leaf dry shank period, at 0.248 kg and 0.0302 kg respectively. This is mainly because the tobacco leaf dry shank requires a higher baking temperature and a large amount of fuel, resulting in the highest NO2 emissions in this stage. The maximum NO2 emission during the yellowing period of the natural gas baking room was 0.034 kg. The NO content in the yellowing and color fixing stages of each energy source is relatively low because the baking time in these two stages is relatively short. The high emission during the drying period is due to the long baking time and high temperature required in the drying oven during this stage.
Analysis on the total amount of main gas emissions from ovens with different energy sources
According to the left of Fig. 9, it can be seen that the emissions of life cycle emission factors of baking in different fuel roasters are biomass, alcohol and natural gas, in descending order. From the analysis of CO2 emissions: Biomass emissions were the highest at 1518.82 kg, followed by alcohol-based and natural gas. This was because biomass contained high levels of C or O elements, which resulted in violent redox reactions during combustion. The other fuels contained lower levels of C or O. From the analysis of SO2 emissions: The highest biomass emission was 4.035 kg, while the emissions of alcohol and natural gas were 0. This is because the S content of alcohol and natural gas fuels was 0, and redox reactions cannot occur. From the analysis of NO emissions: Biomass emissions were the highest at 2.562 kg, followed by alcohol-based and natural gas emissions at 0.156 kg. This is because biomass fuels contain high levels of N and O elements, while natural gas fuels contain 0 O. Although the alcohol fuel contains a high level of O, it only contains 0.06% N, which is why this phenomenon occurs. From the analysis of NO2 emissions: Biomass had the highest emission, natural gas had the lowest emission of 0.035 kg, and the reason for NO2 was the same as NO. The results show that natural gas had the lowest emission among various emission factors.
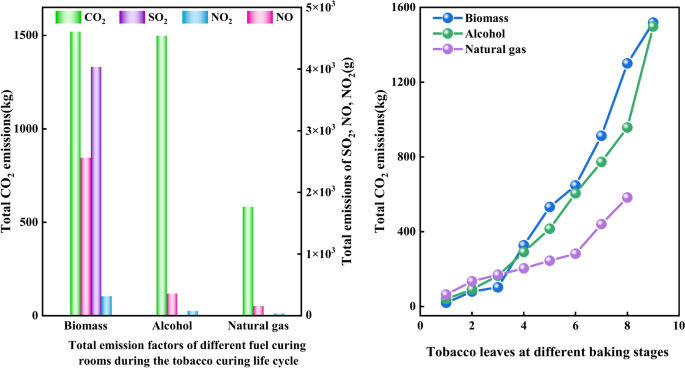
Total emissions of major gaseous emissions from different fuel curing rooms during the tobacco curing life cycle (left) and total CO2 emissions at different curing stages (right).
According to the right side of Fig. 9, it can be seen that the CO2 emissions of various pollutants increase with the increase of baking time. The emission slope of the emission factor shows that the CO2 emissions of the biomass baking room are relatively stable in the early stage of baking, accelerate in the middle stage, and are the fastest in the late stage, with the highest value of 1518.82 kg. The CO2 emission rate of alcohol and natural gas baking rooms is relatively slow, and the emission reaches the maximum in the tenth stage. It may be that they use mechanical feeding method, and the heating is easy to control, while traditional manual coal adding is difficult to accurately control the fuel demand and the heat loss is serious. It can be seen from this that natural gas curing rooms had the lowest CO2 emissions and can subsequently become the main energy source for tobacco leaf curing.
Energy consumption economic evaluation
According to the General Rules for Calculation of Comprehensive Energy Consumption (GB/T2589-2008), fuel and electricity consumption are converted into standard coal consumption. The standard coal conversion coefficient of biomass is 0.5250, the standard coal conversion coefficient of alcohol base is 1.09, and the standard coal conversion coefficient of natural gas is 1.2143. It can be seen from Table 3 that the ratio of fresh smoke to dry smoke after baking is approximately 7:1. In the case of the same proportion of fresh tobacco leaves, it was found that the natural gas consumption was the lowest and the biomass consumption was the highest at 682.50 kg. The power consumption of baking a furnace of tobacco with different fuels was about 250 kw·h. This leads to the conclusion that natural gas should be preferred as the preferred fuel for roasting as natural gas roasters are cheaper, more energy efficient and emit the least amount of pollutants.
As can be seen from the left of Fig. 10, the unit dry tobacco fuel consumption of the natural gas curing room was 0.75 kg, which was 17.58% less than that of the alcohol curing room and 35.34% less than that of the biomass pellets. From the perspective of unit dry tobacco fuel consumption, the natural gas curing room has obvious energy-saving advantages.
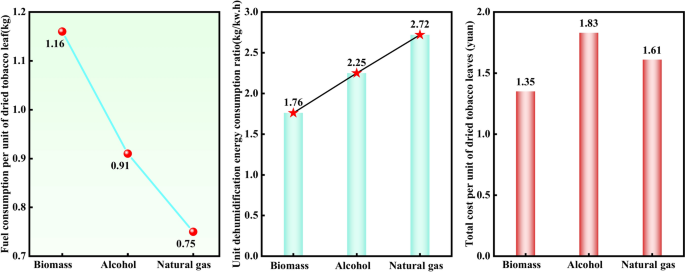
Unit dry tobacco fuel consumption of different fuel curing rooms (left) Unit dehumidification energy consumption ratio (middle) Unit dry tobacco leaf cost over the entire life cycle (right).
It can be seen from Table 4 and Fig. 10 that the moisture content of fresh tobacco in natural gas curing barns is significantly higher than that in curing barns using other fuels. When the weight of fresh tobacco leaves is the same, the power consumption of natural gas curing barns is lower. The unit dehumidification energy consumption ratios of different fuels were 1.76, 2.25 and 2.72, respectively. It is found that the unit energy consumption dehumidification capacity of the natural gas baking room is much higher than that of biomass and alcohol, and its value was 1.55 times that of biomass and 1.2 times that of alcohol. It can be seen that the natural gas curing room has significantly improved the efficiency of tobacco leaf curing, and the drying and energy-saving advantages are obvious.
It can be seen from Table 5 and Fig. 10 on the right that the unit dry tobacco fuel costs of biomass curing room, alcohol-based curing room and natural gas curing room were 1.16 yuan, 1.63 yuan and 1.46 yuan respectively, and the unit dry tobacco electricity costs were 0.19 yuan, 0.20 yuan and 0.15 yuan respectively. Among them, the biomass curing room has the lowest unit dry tobacco fuel cost, and the natural gas has the lowest unit dry tobacco electricity cost. The highest unit dry tobacco leaf cost during the life cycle of baking in flue-curing rooms using different fuels was 1.83 yuan for alcohol tobacco, the lowest was 1.35 yuan for biomass, and 1.61 yuan for natural gas. Although biomass curing room had the lowest cost for drying tobacco leaves, its combustion produces more SO2, NO and NO2. Therefore, in order to develop tobacco baking in a sustainable, environmentally friendly, energy-saving and efficient direction, natural gas and alcohol fuels are preferred because they have obvious advantages in reducing costs and increasing efficiency.