![Current stock market crash vs. top 20 crashes of all time (Updated) [OC]](https://www.europesays.com/wp-content/uploads/2025/04/4tefttxwkrwe1-1920x1024.png)
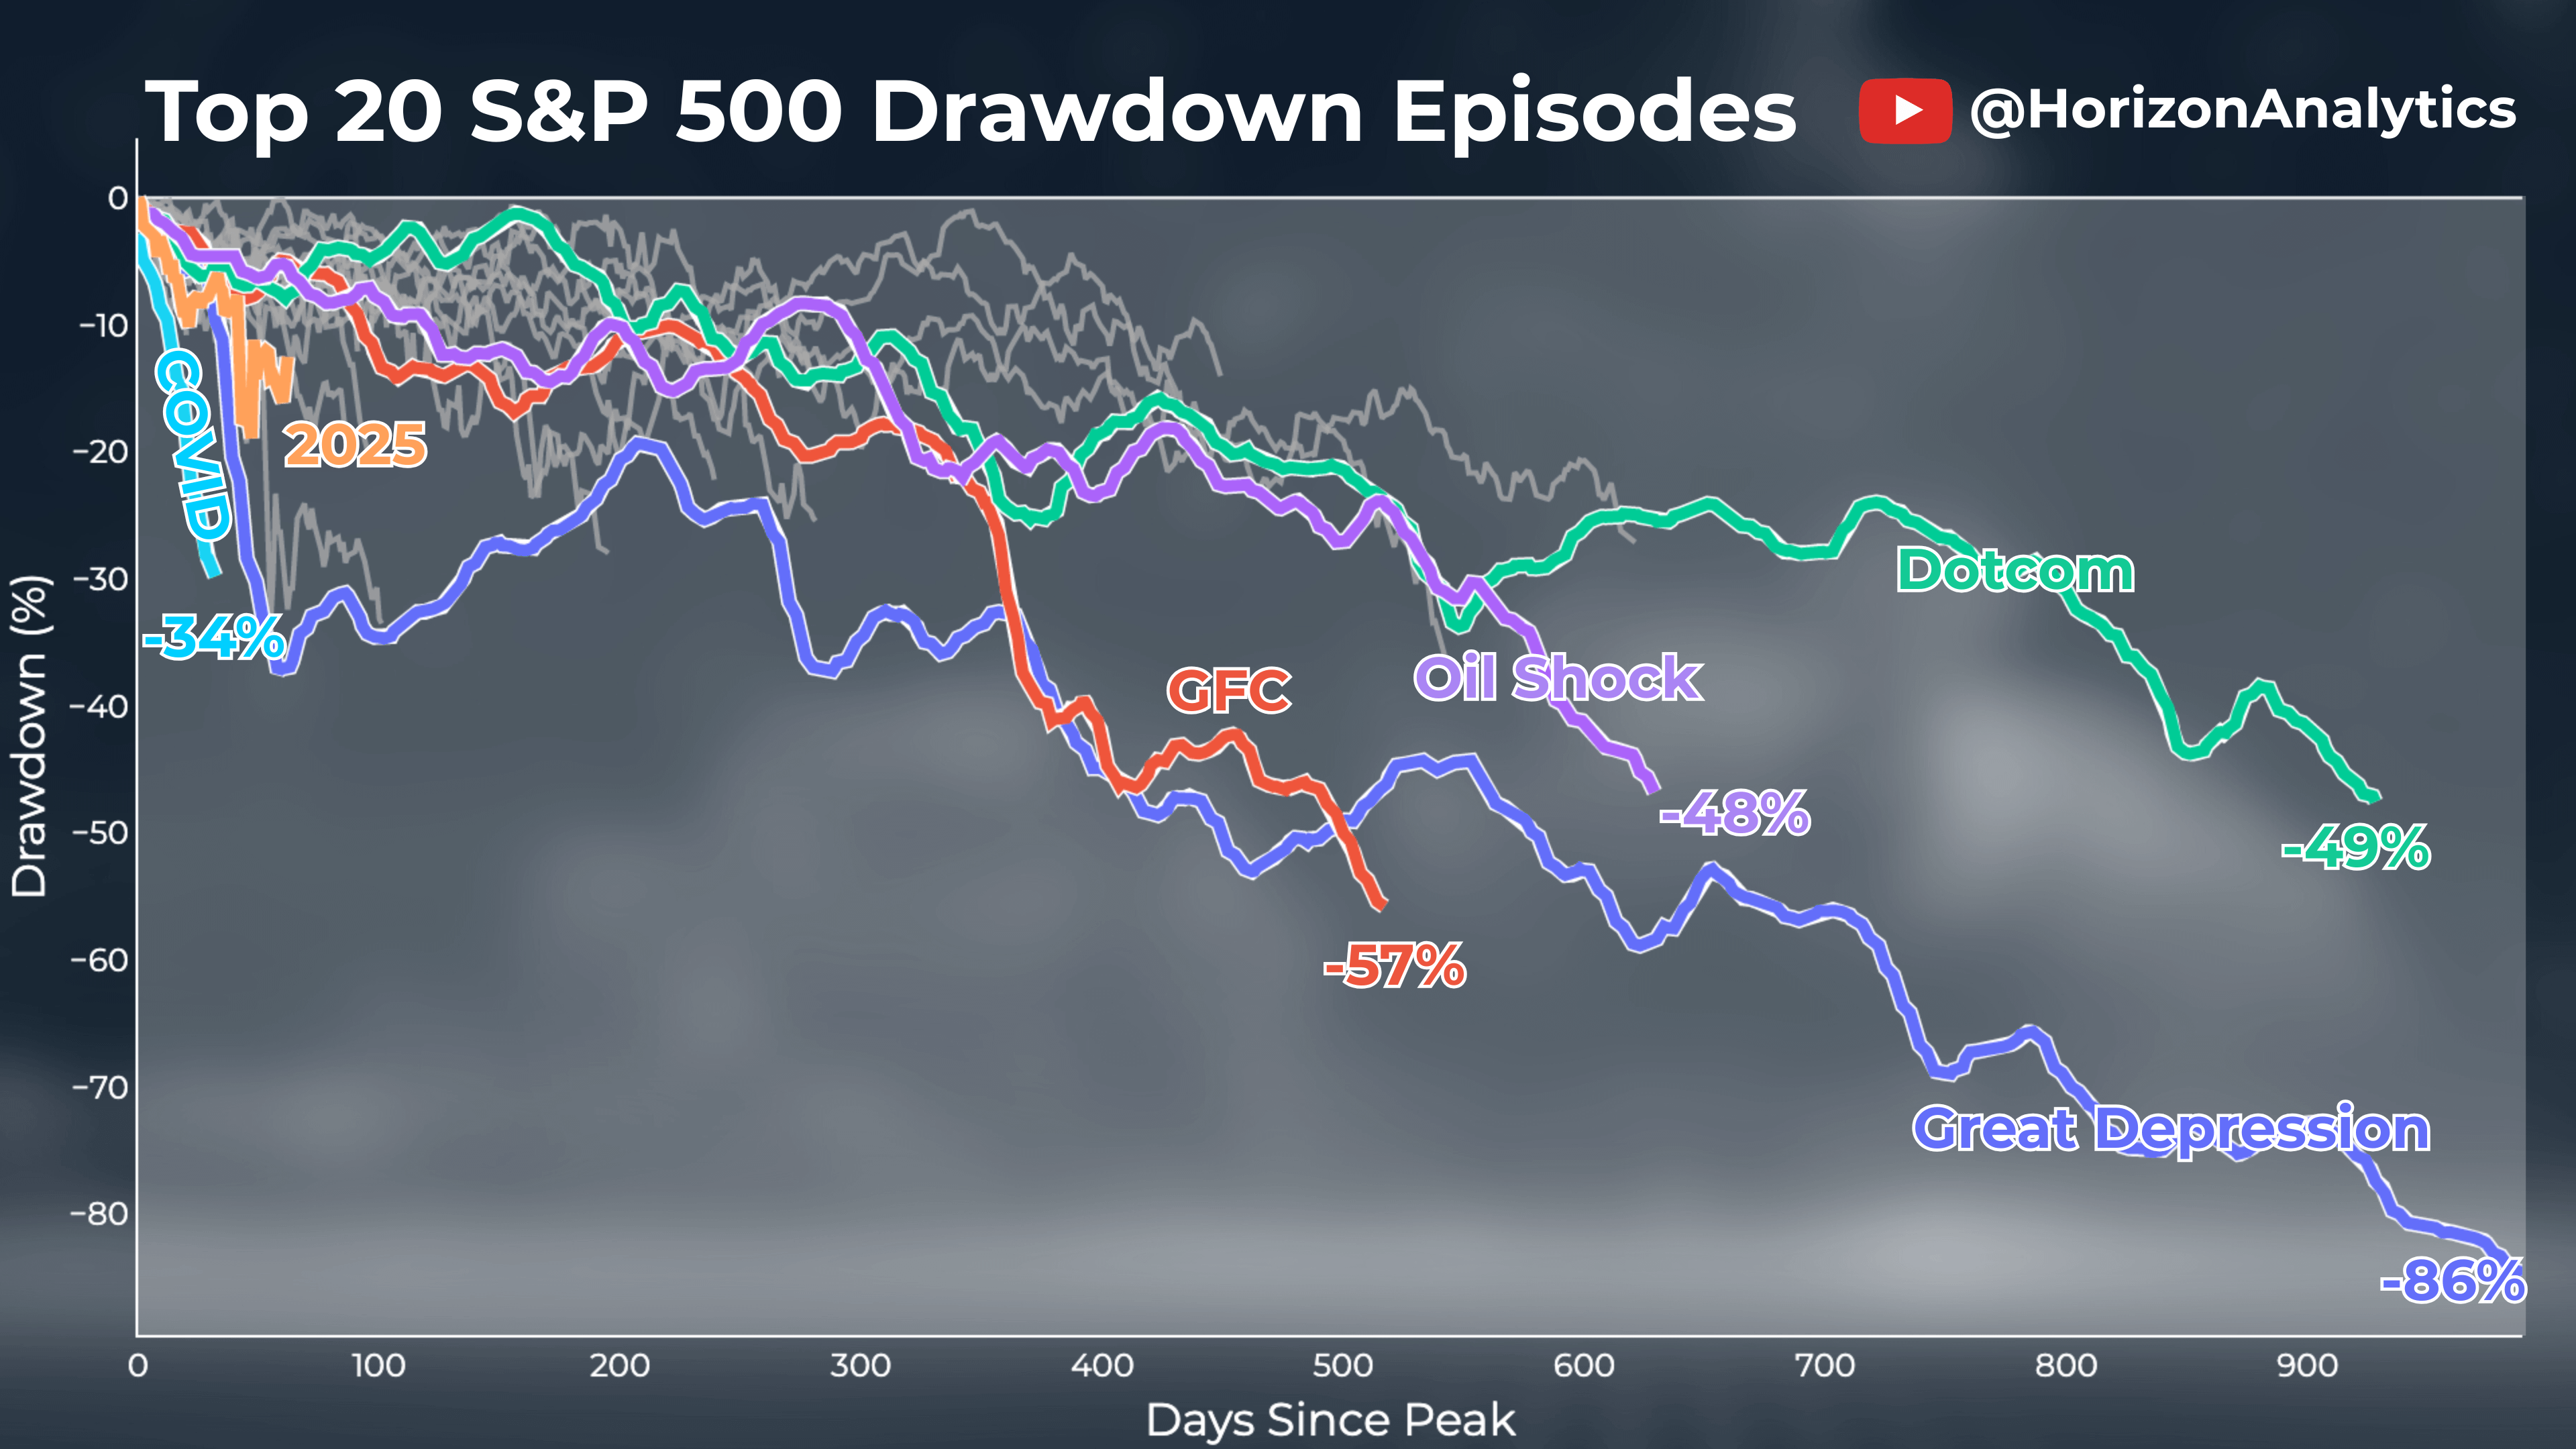
Updated version of u/incitatus451's chart here.
Highlighted drawdowns (Great Depression, GFC, Dotcom Bubble, Oil Shocks, Covid-19) have been smoothed. Grey lines show the rest of the top 20 drawdowns.
Made with yfinance lib data in Python and Canva.
Posted by haphame
25 comments
Not sure if “beautiful” is the right word, though… 😉
You can call it _Trump Crash_.
This is a great chart. Really shows how the 4 longest corrections are in a league of their own.
Everybody flips a shit when prices go down. But the true measure of pain comes with the amount of time it takes to recover.
Would be interesting to see how the market recovered after the 34% crash from COVID as well I think
Cool chart, but you also have to realise the structural changes since 2008.
The FED now tends to pump a bunch of money into the markets as soon as we go down too much (and inflation is low enough too).
So we will easily not go that far down right? Well, also not true. Inflation is projected to stay well above the targetted 2% goal of the FED and the FED chairman has repeatedly said markets are not that bad yet to pump money in.
Amazing he was in power for 2 of them. Some bad luck and some bad decisions
Visually not that appealing. It’s very hard to read the text and follow the lines.
Legend: Call it Trump. It is more accurate and allows the time series to go beyond 2025.
I finally understand the MAGA slogan! Great, as in Great Depression again!
There’s and there was no stock market crash tho. It’s a 9% dip from its maximum historical value. I’m all in to say fuck Trump but there’s no need to exagerete on this one, for now…
Is this confirmation bias? i.e. if you now mapped it against all the other times there has been a drop but it then bounced back, would you also see a similar mapping?
I suspect this will follow some of these btw, i’m just questioning the analysis and whether it is actually showing anything
And original poster said adding color makes it more confusing. Made it SO much easier to read with color, ty
hopefully this will pacify the big babies crying at every little drop of spilt orange juice 👶
Also the market dropped like it did because the wall street scum that borrowed from the japanese banks had to return the money.
Trump slump dumps chumps, pumps grumps.
was covid crash only for 50 odd days? and I am interested to know what that other one in grey (over 125 days odd) that has a similar sort of drawdown as covid
Which one is the video game crash?
Still time to crash and continue to invest all the way down
The year would be good. I’m not sure what GFC is or when Oil shocks started.
Crazy you included your yt on a chart you made worse.
As the guy would say…. Or cray was the biggest crash, nobody crashes the stock market like we do.
Everyone is saying that we crashed the stick market the best, the fastest. Or method of crashing it had never been seen before, which means it’s the best
Is the devaluation of the dollar calculated in this?
[removed]
Who’s ready for a shooting war in the Middle East?! Buckle up, Trump is just getting started.
Could you have made this any harder to read?
S&P500 is down 7.6% in the last 6 months. Not great, but not enormous.
The market reflect confidence, not the economy… so this is understandable as investors don’t know what’s going to happen with Trumps wildly changing (moronic) tariff policy
It’s also important to look at the 200 day moving average and such. We were due for a correction soon as the market has been overvalued for some time.
Comments are closed.