Debates around human wellbeing normally cluster around hedonic and eudemonic conceptions34. Broadly, questions of individual emotion, happiness, pleasure, and comfort are central to the former, while questions of social conditions, flourishing, purpose, meaning, and functioning are the foci of the latter. Human needs work sits within the latter eudemonic tradition, and the Decent Living Standards (DLS) framework1 was developed with reference to various theories of needs35,36. The primary goal of DLS was to bridge the gap between the abstractions of needs theories and material reality. DLS thus proposes an inventory of material resources that are required for a decent life in our modern industrial societies, which go beyond mere subsistence and the extreme poverty that international income poverty lines measure.
The DLS inventory used in the current work (Table 1) is built upon that used in previous global modelling4,6, with some significant additions. These include household furnishing (which were previously implicit in the assessment of energy embodied in residential construction, but we consider here explicitly) and cleaning products (which were previously absent). We also add public indoor space, and other public activities, including security and research. These were not included in previous DLS studies, but they are clearly required for meeting human needs like social participation & understanding, safety, healthcare, etc.
We use a mix of three approaches to fully quantify activity-levels across the DLS inventory:
First, where the specific Swiss context is expected to influence required activity-levels (and we can quantify this), we make bespoke estimates. Food and mobility are good examples – we estimate required food consumption using data from the United Nations FAO, which accounts for the population structure of Switzerland; we estimate required mobility per-person by considering demographic and spatial characteristics of Switzerland, as well as current mobility patterns in terms of the trip purposes and modes used.
Second, when there is nothing specific about Switzerland that leads us to believe that more or less consumption is required to meet a particular need (or we simply cannot assess what this variation should be), we use a general assumption made in previous global modelling. Examples are household direct water use (50 L cap-1 year-1) and annual consumption of new clothing (3.6 kg cap-1).
Finally, where it is not possible for us to properly quantify an activity-level, we rely upon more heuristic methods (for example, for Healthcare and for Communication and Information). Full details on activity-levels are in Supplementary Methods 1.
Decent living energy
DLE models are considered bottom-up, as they estimate the energy requirements of human wellbeing by building up piece-by-piece from a specific set of goods and services – in this case, the decent living standards inventory. In contrast, top-down methods consider society-wide indicators of human wellbeing, such as life expectancy or life satisfaction, and analyse how much energy or resources societies currently use to reach sufficient levels on these indicators5. Consequently, they do not consider how energy and resource use is translated by societies into the goods, services, and conditions that contribute to meeting human needs – they are blind to the numerous inefficiencies occurring along this chain and tend to overestimate the environmental impacts of providing human wellbeing. The deficiencies of bottom-up models typically bias them in the opposite direction – they are more likely to omit things that are relevant to human wellbeing than include things that are not, and they typically assume that goods and services are translated into human wellbeing with near-perfect efficiency via, for example, unrealistically high distributive equality. The omissions of existing work highlighted in the previous subsection (household furnishing, public indoor space, etc.) represent a good example of this issue of underestimation. Therefore, by broadening the dimensions considered in decent living standards, we aim to mitigate this in the current DLE model. Nonetheless, DLE models, including ours, are best suited to defining ambitious minimum thresholds of energy use that are required to meet basic needs, and secure a decent standard of living well beyond subsistence.
The difficulties of DLE models lie in the process of specifying appropriate activity-levels, and deriving associated energy intensities based on an assumed type and level of technology. But once these activity-levels and intensities are defined, estimating DLE is mathematically simple, and involves multiplying them together and summing across all dimensions of the decent living standards inventory3,4. The methodology is summarised in Fig. 6.
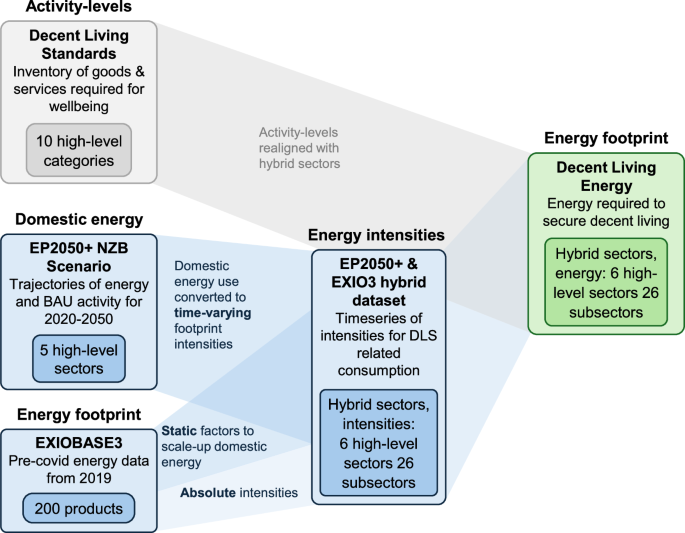
Activity-levels are defined for each Decent Living Standard, and energy intensities derived from EP2050+ and EXIOBASE3. All calculations were undertaken in a spreadsheet model (MS Excel).
Energy intensity calculations
Previous DLE work generally derived final energy intensities for each aspect of the DLS inventory by looking to literature from Life Cycle Assessment and Input Output analysis5,6. Calculations were largely done bottom-up at the product-level, by estimating, for example, the energy required to produce a particular item of clothing, to wash a single kg of clothing, and to manufacture a washing machine. Work at the global level did this with differing assumptions about technological efficiency, thus producing distinct scenarios4,5. Differences in energy intensities between countries were sometimes estimated robustly (for example, for thermal comfort) but other times quite crudely (for example, for construction).
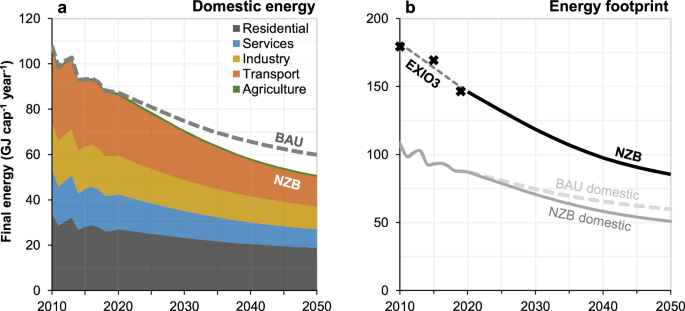
In the current work, we look primarily to a net-zero emissions scenario from the Swiss government – namely, the EP2050+ Net Zero Basis scenario20 – then to other data measuring Switzerland’s current energy footprint so that we include energy used in global supply chains supporting Swiss consumption. This approach has the advantage of producing energy intensities specific to Switzerland, and it allows us to produce a timeseries of DLE matching the horizon of EP2050+. The main drawback is that the categories used in both datasets are not aligned with the DLS inventory of Table 1 and correcting this is a non-trivial issue (we describe our navigation of this in Supplementary Methods 2). All intensities are summarised in Table 3 and Table 4.
Three different steps are involved when estimating our energy intensities (see Fig. 6):
The first simply uses domestic intensities taken from the EP2050+ Net Zero Basis scenario. This is done where an EP2050+ sector can be directly related to a DLS dimension. For example, EP2050+ reports the final energy intensity of residential heating and the associated floor space (over the 2020–2050 period), so a time-varying intensity can easily be extracted (in MJ m-2).
The second step involves using final energy footprint data from EXIOBASE 322 to estimate the fraction of energy use that is missed by the domestic scope of EP2050+. For example, EP2050+ projects energy use for Swiss healthcare, but EXIOBASE tells us that domestic energy use only makes up ~40% of the total Swiss healthcare footprint, thus 60% is not covered by EP2050 + . Factors such as this are used to increase the EP2050+ intensities, and we assume the share of the Swiss footprint occurring outside of Switzerland remains fixed from 2020-2050.
The third step is used only where a part of the DLS inventory cannot be aligned with an EP2050+ sector, and hence has not been prescribed an energy intensity via the two steps above. In this case, we use the absolute energy intensities from EXIOBASE, and heuristic estimates of how these may change from 2020 to 2050. Clothing purchases are an example – these are not covered by EP2050+ and are largely imported, but EXIOBASE data can be used to estimate the energy intensity of Swiss consumption (in MJ kg-1).
Domestic energy intensities
Energy Perspectives 2050 + 20 develops scenarios describing how Switzerland can move to a net-zero emissions energy in 2050. Multiple scenarios are available, and we focus on the central Zero Basis one. This assumes widespread, rapid deployment of well-known mitigation strategies: renewable energy (hydropower, solar, wind, biomass, etc.), energy efficiency (better insulated building envelops, district heating systems, LED lighting, etc.), alternative fuels (hydrogen, biomass, etc.), and electrification (residential and commercial heat pumps, electric road vehicles, etc.). Alongside this, it assumes substantial deployment of carbon capture and storage. In contrast to these ambitious technological transformations, activity-levels – and hence Swiss living standards – are fixed to business-as-usual levels across all EP2050+ scenarios. While we focus only upon final energy, the assumed deployment of low-carbon technologies in EP2050+ may also imply reduced primary energy consumption in key sectors like transport (which would be the case even with activity-levels fixed).
We extract final energy consumption by sector from the EP2050+ NZB outputs, to be consistent with the DLE methodology. The data are reported for five high-level sectors (residential, services, transport, industry and agriculture) and various subsectors, and we produce a hybrid sector-list to align these with the DLS inventory of Table 1 as closely as possible (see Supplementary Table 6). Much of the industry sector is treated differently, for two reasons: (i) the EP2050+ industrial categories are not final products but rather intermediate ones (steel, cement, glass, etc.) which have no direct relationship with decent living categories, and (ii) most of the goods in the DLS inventory that are consumed in Switzerland (washing machines, cold storage, computers and phones, etc.) are not manufactured domestically, so to consider these we must look to energy footprint data.
An important implication of this approach – that is, our integration of energy intensities from the NZB scenario into our DLE model – is that we implicitly assume the same mix of end-user technologies deployed in the NZB scenario in our DLE estimates. This means that the energy intensities we use for private vehicles, for example, reflect the average Swiss stock assumed in EP2050+, which includes SUVs and other oversized vehicles. The DLS framework is not prescriptive about what private vehicles are and are not decent, so to speak, but it would be difficult to argue that these oversized vehicles are – despite our implicit inclusion of them. Our DLE estimate should thus be understood as a decomposition of an ambitious net-zero emissions scenario for Switzerland into the energy that is providing DLS, and that supporting consumption in excess of this. It is not a transformative, egalitarian sufficiency scenario, as has recently been explored elsewhere29.
Supply chain energy intensities
The energy footprint data we use is from EXIOBASE 3, a global, multiregional environmentally-extended input-output database with 200 product categories across 49 countries/regions22. Swiss energy footprint data from EXIOBASE describes the energy embodied in all Swiss consumption – household, government, non-profit institutes, and infrastructure investment – and it associates this energy with all 200 final products and 49 world regions. It describes, for example, the embodied energy of producing all motor vehicles purchased in Switzerland in 2019, and the share of this occurring in Switzerland (4%) and elsewhere (96%). We use the energy extension (Energy Carrier Net Total) describing the primary energy footprint of Switzerland in 2019, and ignore more recent data affected by COVID19. To convert this to a final energy footprint, we simply reduce it uniformly (i.e., across all product categories) by the 2020 ratio of final to primary energy reported in Switzerland by EP2050+, which is 0.75. EXIOBASE data was extracted with the open-source Python package, pymrio (https://doi.org/10.5281/zenodo.1146054).
Energy inequality
To account for energy inequalities within Switzerland, we implement energy Gini coefficients in the simple analytical formulas recently provided by Pauliuk26. By assuming a common distributional form of the Lorenz curve, these relate the minimum DLE requirement for the bottom decile of a population (DLE) to the mean consumption of the full population (avg), and the top decile (max), via the Gini coefficient (G), with all energy data expressed in per capita terms:
$${{\rm{avg}}}=\frac{1+{{\rm{G}}}}{1-G}\times {{\rm{DLE}}}$$
(1)
$$\max={{\rm{avg}}}\times 10\times {0.1}^{\left(\frac{1-G}{1+G}\right)}$$
(2)
For example, when G is 0.2 (or 0.5), Eq. (1) suggests that securing DLE for the bottom decile of a population requires average energy consumption of 1.5×DLE (3×DLE), and Eq. (2) that maximum consumption will be roughly 3×DLE (14×DLE).
We assume that the current energy Gini for Switzerland matches the Gini of consumption expenditure, as data suggests that inequality in energy footprints and expenditure are very similar at the level of the latter observed in Switzerland37. This expenditure Gini is reported by the Swiss Federal Statistical Office (FSO)38 most recently in 2014 at 0.26. Other data from the FSO39 suggests that the Gini of disposable income has risen marginally since then (from 0.29 to 0.3 from 2014 to 2021). We thus assume the expenditure Gini, and hence energy Gini, have risen by the same amount and reached 0.27.
We also make a heuristic estimate of fair inequality following previous work. This took the fair maximum income ratios reported by Kiatpongsan and Norton40 from survey data in 40 countries, and translated these into fair levels of energy and carbon footprint inequality41. Specifically, Swiss residents were found to consider a ratio of ~5:1, on average, to be fair for the income of CEO’s and unskilled workers.
The simple parameterisation of inequality we use allows us to easily consider a range of Gini coefficients, but future work would benefit from empirically analysing the specific distribution of energy inequality in Switzerland.
Reporting summary
Further information on research design is available in the Nature Portfolio Reporting Summary linked to this article.