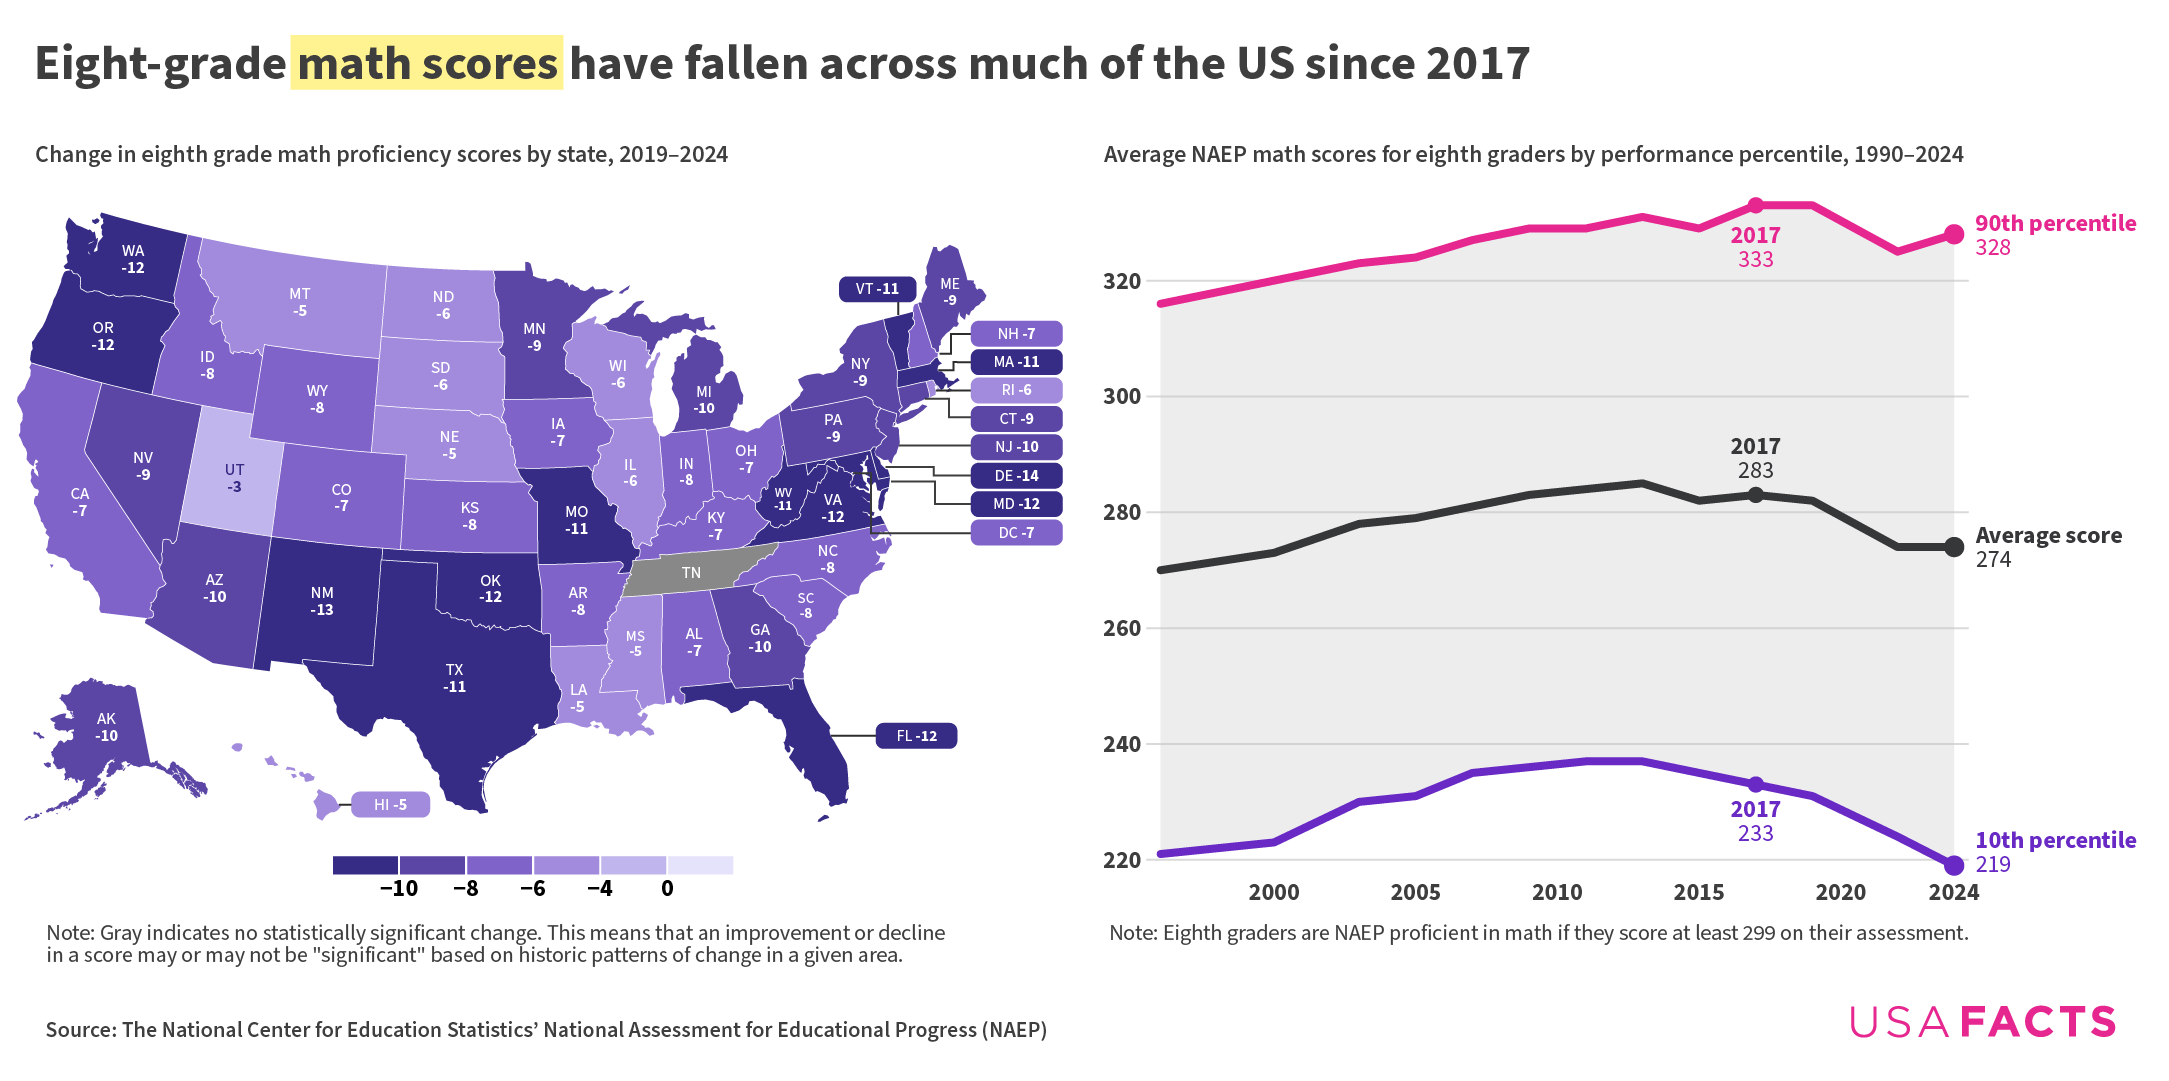
It appears to start declining much sooner than that, around 2012 and the advent of the smartphone.
The 2024 Nation’s Report Card (aka the National Assessment for Education Progress or NAEP) tested about 111,000 eighth graders in math on a 0-500 scale (299 = “proficient”). The national average score was 274, unchanged from 2022 but nine points below 2017’s peak of 283. Forty-nine states plus Washington, DC, have seen statistically significant declines since 2019; Tennessee is the lone exception.
Score changes were not uniform across students:
* High performers (90th percentile) gained 2–3 points from 2022, reaching 328.
* Low performers (10th percentile) fell 2–5 points, landing at 219.
* The share of students meeting the proficiency bar was 28 % in 2024, up two points from 2022 yet still six points below 2019.
Edit: I obviously misspelled “eighth” in the chart title on purpose as a funny joke about proficiency. It was definitely not a mistake. Definitely not… oof.
How have the demographics changed among 8th grades since 2012 when the scores began to fall?
Does Tennessee not have math?
I wonder how much this has to do with the proliferation of cheating technology
So how big is this gap in context? What does a 320 v a 220 score look like?
I was a 8th grader in 2017 at an above average public school and considering how bad most people were at math, this is frightening. Covid lockdown did a number on all students development, but current 8th graders who were developing basic math skills at the time were probably hit the hardest. Not shocking but certainly sad.
If there’s one silver lining in these charts is that it shows COVID barely affected the trend of average and 10th percentile scores. They were already getting bad, and continued that way.
If those kids could read this chart they would be very upset .
Can’t decide if this is a “kids theses days” post or America bad free upvotes to the left post.
First: NAEP is a legacy of the failed no child left behind act, I don’t think we should be taking it seriously. They also have massive problems with marking answers wrong/right incorrectly because their testing is so bad.
Second: NAEP testing is not done universally, instead it is a “sample” which is often poorly distributed.
Third: Schools don’t use NAEP testing for grades, mainly because it’s a horrible test. As someone that took one of these tests before, we were told that it didn’t count for a grade, and it gets annoymonized. Our teacher told us something like, “I have been told to ask you to take it seriously and to treat it like a real test.” Anyone that used to be 12 years old can tell you how seriously a 12 year old takes the test.
Fourth: This isn’t an apples to apples measurement. What was “proficient” in 2000 is much easier than what is considered “proficient” in 2025.
Fifth: Newer NAEP testing controls and breaks out children on 504/IEP that need accommodations, and grades them. It’s not clear which one you used, accommodations or non accommodations. But in the past, children with special needs would just not take the test. I think you could see the problem with not including this group in the past but now including them.
I mean Covid was a pretty extreme time, idk if I’d count the obvious dip that would occur during and after that against the system. But a decline before that is concerning.
We really need a United national curriculum, longer schooldays, a shortened summer break, and more investment in teachers.
“You’re not always going to have a calculator in your pocket” was no longer sound reason by the time Gen Z got to middle school. When was the last time you saw anyone do math without at least checking it on a computer? It’s a little sad but not surprising.
Incredibly interesting data and this trend is definitely true (math teacher perspective), but there are multiple issues with the validity of the data.
One year, i sent an email home to parents telling them their rights regarding state testing and gave links on what the data is used for and how to opt out. We had a high percentage of students opt out. The state’s response: if 10% or more parents exercise their rights and opt their students out of state testing, your school report card score drops 5 points. The solution: take the test but it literally doesn’t affect you so go ahead and randomly guess.
People just don’t care. Why should a student try their hardest when they get nothing in return? Do you work overtime for a “thank you” note written by the governor? These kids are educated enough in knowing their rights and not appeasing others for no benefit.
I know I’m comparing state v federal systems, but it’s the same issue – kids are taken out of classes to take the NAEP and are not excused from work they missed.
If my math is correct, my state is one of the worst! But since I’m from that state, don’t count on my math.
The more interesting part to me is the divergence between the top 10% and the bottom 10%. I have heard that low income families are worse at keeping screen time limited for their kids, which intuitively would explain this data. I feel like that ‘reversal’ in the 90th percentile is higher income parents finally realizing that screen time is bad, and actually limiting it. Schools are also starting to do this, but that will take time to show up in the data IMO.
All three of those levels seem to revert back to the 2000 mean. Do we know this isn’t just the rise and decline of “teaching to the test?”
AI will solve this. (The test scores, not the dumbing of America)
Now let’s throw in smartphone usage to see if there’s a correlation.
These 8th graders would be voting age by now…
the decline starts right when smart phones and social media boom began 2012 ish
is there a genuine reason as to why it varies per state – for example California (D) -7 and Utah (R) -3, while virgina (D) -12 and Texas (R) -11
This doesn’t tell you much? Is this normalized across all states because there’s no national test/standard. For instance you’d have to take the GEPA, in New Jersey, and compare that to whatever the eighth grade test is in every other state, if there is one, and see what the change is.
How come Utah had such a small decline relative to other states?
Covid learning gap is real for the lowest learners. Kids who were already at risk didn’t have home supports to accommodate a year or more of at-home learning and fell further behind.
That’s an insane drop
I honestly think we will see the US fall in the next 100 years
I mean, COVID has had quite an impact, but also our education system just moves up everyone, even if the next grade is way too hard or way too easy, which leads to kids who find work too hard having even more trouble and kids finding work way too easy (like me) finding school too easy and easily getting bored.
It’s not the students, it’s the teachers.
Not to brag, but I was in 8th grade in 2013 😏
DoE at fault? In Aus at least claiming our problems on the goverment is common
Just wish they would go back to regular math instead of what there teaching now a days, I haven’t had to use any of the information I learned in school beyond basic addition and subtraction and how to write. Even then mostly just have to sign my name write the date and fill out a check sheet daily
The dumbing down of American society is going to be used as an excuse to cut the Department of Education. Just in time for tariffs to bring back manufacturering to the states.
Why does this chart begin in 2000?
Hasn’t America always been horrendous on the math knowledge world scale?
I am scared. I am in my 40’s and these are idiots taking care of the world when I retire.
Common core math was introduced in 2010 which is around the peak of those graphs, I wonder if a significant factor is the parents lack of ability to help their kids with the unfamiliar style of math. I also get that the iPhone came out around this time, and it’s likely people just started using the calculator instead of doing math in their head.
Look I like kicking the US for its political situations but math… math can go fuck itself worldwide. 99% of us do not use anything beyond 4th or 5th grade math. I’d be more interested in data that tests critical thinking than whether or not Billy or Sandy can figure out Pythagorean theorem. Maths should be an elective after middle school.
I went to elementary school in the 1960’s. Parents coudn’t help with homework because of the “new math”. Nothing has changed.
How much of this can be tracked to covid? Seems like everyone and their grandmother was telling me that kids not maintaining the regular schedule would have adverse affects for years to come
![[OC] Declining eighth-grade math proficiency in the US](https://www.europesays.com/wp-content/uploads/2025/04/eexorcbu01ye1-1920x1024.png)
39 comments
Source: [National Center for Education Statistics](https://www.nationsreportcard.gov/reports/mathematics/2024/g4_8/national-trends/?grade=8)
Tools: Datawrapper, Illustrator
More data on fourth- and eighth-grade math and reading scores [here](https://usafacts.org/articles/covid-disrupted-decades-of-progress-in-math-and-reading/).
It appears to start declining much sooner than that, around 2012 and the advent of the smartphone.
The 2024 Nation’s Report Card (aka the National Assessment for Education Progress or NAEP) tested about 111,000 eighth graders in math on a 0-500 scale (299 = “proficient”). The national average score was 274, unchanged from 2022 but nine points below 2017’s peak of 283. Forty-nine states plus Washington, DC, have seen statistically significant declines since 2019; Tennessee is the lone exception.
Score changes were not uniform across students:
* High performers (90th percentile) gained 2–3 points from 2022, reaching 328.
* Low performers (10th percentile) fell 2–5 points, landing at 219.
* The share of students meeting the proficiency bar was 28 % in 2024, up two points from 2022 yet still six points below 2019.
More data (including a look at reading scores, which also declined in 38 states) [here](https://usafacts.org/articles/covid-disrupted-decades-of-progress-in-math-and-reading/) if you’re curious!
Edit: I obviously misspelled “eighth” in the chart title on purpose as a funny joke about proficiency. It was definitely not a mistake. Definitely not… oof.
How have the demographics changed among 8th grades since 2012 when the scores began to fall?
Does Tennessee not have math?
I wonder how much this has to do with the proliferation of cheating technology
So how big is this gap in context? What does a 320 v a 220 score look like?
I was a 8th grader in 2017 at an above average public school and considering how bad most people were at math, this is frightening. Covid lockdown did a number on all students development, but current 8th graders who were developing basic math skills at the time were probably hit the hardest. Not shocking but certainly sad.
If there’s one silver lining in these charts is that it shows COVID barely affected the trend of average and 10th percentile scores. They were already getting bad, and continued that way.
If those kids could read this chart they would be very upset .
Can’t decide if this is a “kids theses days” post or America bad free upvotes to the left post.
First: NAEP is a legacy of the failed no child left behind act, I don’t think we should be taking it seriously. They also have massive problems with marking answers wrong/right incorrectly because their testing is so bad.
Second: NAEP testing is not done universally, instead it is a “sample” which is often poorly distributed.
Third: Schools don’t use NAEP testing for grades, mainly because it’s a horrible test. As someone that took one of these tests before, we were told that it didn’t count for a grade, and it gets annoymonized. Our teacher told us something like, “I have been told to ask you to take it seriously and to treat it like a real test.” Anyone that used to be 12 years old can tell you how seriously a 12 year old takes the test.
Fourth: This isn’t an apples to apples measurement. What was “proficient” in 2000 is much easier than what is considered “proficient” in 2025.
Fifth: Newer NAEP testing controls and breaks out children on 504/IEP that need accommodations, and grades them. It’s not clear which one you used, accommodations or non accommodations. But in the past, children with special needs would just not take the test. I think you could see the problem with not including this group in the past but now including them.
I mean Covid was a pretty extreme time, idk if I’d count the obvious dip that would occur during and after that against the system. But a decline before that is concerning.
We really need a United national curriculum, longer schooldays, a shortened summer break, and more investment in teachers.
“You’re not always going to have a calculator in your pocket” was no longer sound reason by the time Gen Z got to middle school. When was the last time you saw anyone do math without at least checking it on a computer? It’s a little sad but not surprising.
Incredibly interesting data and this trend is definitely true (math teacher perspective), but there are multiple issues with the validity of the data.
One year, i sent an email home to parents telling them their rights regarding state testing and gave links on what the data is used for and how to opt out. We had a high percentage of students opt out. The state’s response: if 10% or more parents exercise their rights and opt their students out of state testing, your school report card score drops 5 points. The solution: take the test but it literally doesn’t affect you so go ahead and randomly guess.
People just don’t care. Why should a student try their hardest when they get nothing in return? Do you work overtime for a “thank you” note written by the governor? These kids are educated enough in knowing their rights and not appeasing others for no benefit.
I know I’m comparing state v federal systems, but it’s the same issue – kids are taken out of classes to take the NAEP and are not excused from work they missed.
If my math is correct, my state is one of the worst! But since I’m from that state, don’t count on my math.
The more interesting part to me is the divergence between the top 10% and the bottom 10%. I have heard that low income families are worse at keeping screen time limited for their kids, which intuitively would explain this data. I feel like that ‘reversal’ in the 90th percentile is higher income parents finally realizing that screen time is bad, and actually limiting it. Schools are also starting to do this, but that will take time to show up in the data IMO.
All three of those levels seem to revert back to the 2000 mean. Do we know this isn’t just the rise and decline of “teaching to the test?”
AI will solve this. (The test scores, not the dumbing of America)
Now let’s throw in smartphone usage to see if there’s a correlation.
These 8th graders would be voting age by now…
the decline starts right when smart phones and social media boom began 2012 ish
is there a genuine reason as to why it varies per state – for example California (D) -7 and Utah (R) -3, while virgina (D) -12 and Texas (R) -11
This doesn’t tell you much? Is this normalized across all states because there’s no national test/standard. For instance you’d have to take the GEPA, in New Jersey, and compare that to whatever the eighth grade test is in every other state, if there is one, and see what the change is.
How come Utah had such a small decline relative to other states?
Covid learning gap is real for the lowest learners. Kids who were already at risk didn’t have home supports to accommodate a year or more of at-home learning and fell further behind.
That’s an insane drop
I honestly think we will see the US fall in the next 100 years
I mean, COVID has had quite an impact, but also our education system just moves up everyone, even if the next grade is way too hard or way too easy, which leads to kids who find work too hard having even more trouble and kids finding work way too easy (like me) finding school too easy and easily getting bored.
It’s not the students, it’s the teachers.
Not to brag, but I was in 8th grade in 2013 😏
DoE at fault? In Aus at least claiming our problems on the goverment is common
Just wish they would go back to regular math instead of what there teaching now a days, I haven’t had to use any of the information I learned in school beyond basic addition and subtraction and how to write. Even then mostly just have to sign my name write the date and fill out a check sheet daily
The dumbing down of American society is going to be used as an excuse to cut the Department of Education. Just in time for tariffs to bring back manufacturering to the states.
Why does this chart begin in 2000?
Hasn’t America always been horrendous on the math knowledge world scale?
I am scared. I am in my 40’s and these are idiots taking care of the world when I retire.
Common core math was introduced in 2010 which is around the peak of those graphs, I wonder if a significant factor is the parents lack of ability to help their kids with the unfamiliar style of math. I also get that the iPhone came out around this time, and it’s likely people just started using the calculator instead of doing math in their head.
Look I like kicking the US for its political situations but math… math can go fuck itself worldwide. 99% of us do not use anything beyond 4th or 5th grade math. I’d be more interested in data that tests critical thinking than whether or not Billy or Sandy can figure out Pythagorean theorem. Maths should be an elective after middle school.
I went to elementary school in the 1960’s. Parents coudn’t help with homework because of the “new math”. Nothing has changed.
How much of this can be tracked to covid? Seems like everyone and their grandmother was telling me that kids not maintaining the regular schedule would have adverse affects for years to come
Comments are closed.