+1 for mass having terrible traffic and a*hole drivers but low accidents
Aggressive is… Good?
Damn, Mississippi last in everything
Each time I see a map with datas by State, I wonder how Mississippians and Louisianians manage to survive.
This really needs to be normalized by miles driven by motor vehicles.
Why are the lightest colors in the middle range?
It’s amazing how closely this map correlates tonthe map of higher education levels.
This map sorta reflects urbanization.
More urbanized states have less need for driving between areas. Less wildlife to encounter. More healthcare areas accessible in case an injury occurs. Faster response time to crashes and wrecks (both reporting them, and actually reaching the injured with care).
There are nuances, but also this is just one years data. So that could explain some of that.
Upstate New York has an awful lot of traffic enforcement stationed on its 65-mile-per-hour freeways with design standards that beg for speed, then you get off and take side roads with blind unbanked hairpin turns and value-engineered guardrail placements. I don’t want to encourage any of that
Oh look, there’s Montana and its lax dui laws.
As an aside, some of those colors may be difficult for folks with protanopia type colorblindness to differentiate.
In Mississippi, you can drink while driving as long as you’re under the limit. You can drive with an open container of alcohol. I wonder if this correlates…
Any reason you didn’t use all greens?
Anyone from the DoT care to share the research on the causality of this data?
The are so many different overlays or XYZ where the Bible Belt is always lit up like a Christmas tree – education, poverty, income, homicides, etc. I’m starting to think it’s more than coincidence.
I’ve witnessed 2 terrible accidents in Montana, one was caused by a deer, the other an elk in a snow storm. Everyone else there knows someone killed by a drunk driver too.
New Jersey vindicated again.
This is 2021 data. So road deaths will be far lower in states that still had COVID restrictions (less driving to work/school) in addition to whatever else is causing this.
I see a lot of US maps of interesting stats and the one thing they all tell me is there is no way in hell I’d live in MS.
Now throw in Canadian provincial data.
Now do a compare and contrast this with fatalities per 100 million vehicle miles traveled. The link below is for 2022 data. For example, California is ranked 21st based on population but 32nd based on mileage and Indiana is ranked 29th based on population but 9th based on mileage. Rhode Island is tied for 1st in population and is also 1st based on mileage.
Is Mississippi ok? They seem to always have the worst scores in every data set.
Texas is usually ranked better than all its neighbors on these kinds of maps but I’m kind of shocked that holds up on this particular one
Okay now where’s the map of States with mandatory inspection laws
Honestly shocked by Utah and Washington.
Hard to die if you’re stuck going 15mph on 287.
Cumberland county most resembles the rural south, full of 4 way stop signs on 50mph roads, plus the countless memorials on RT55. But, the vast majority of us live in the NY metro area, and NJ is 23rd highest in 2022 for pedestrian deaths by auto per capita per NHTSA. We’re still consistently top 15 for states with highest premiums, and deservedly so.
Why is the south like that
I live in New Zealand, which is basically 99% winding two lane roads with single lane bridges, steep drop offs, and some of the most selfish, stupid, aggressive drivers on the planet. We’re 5.4 per 100k.
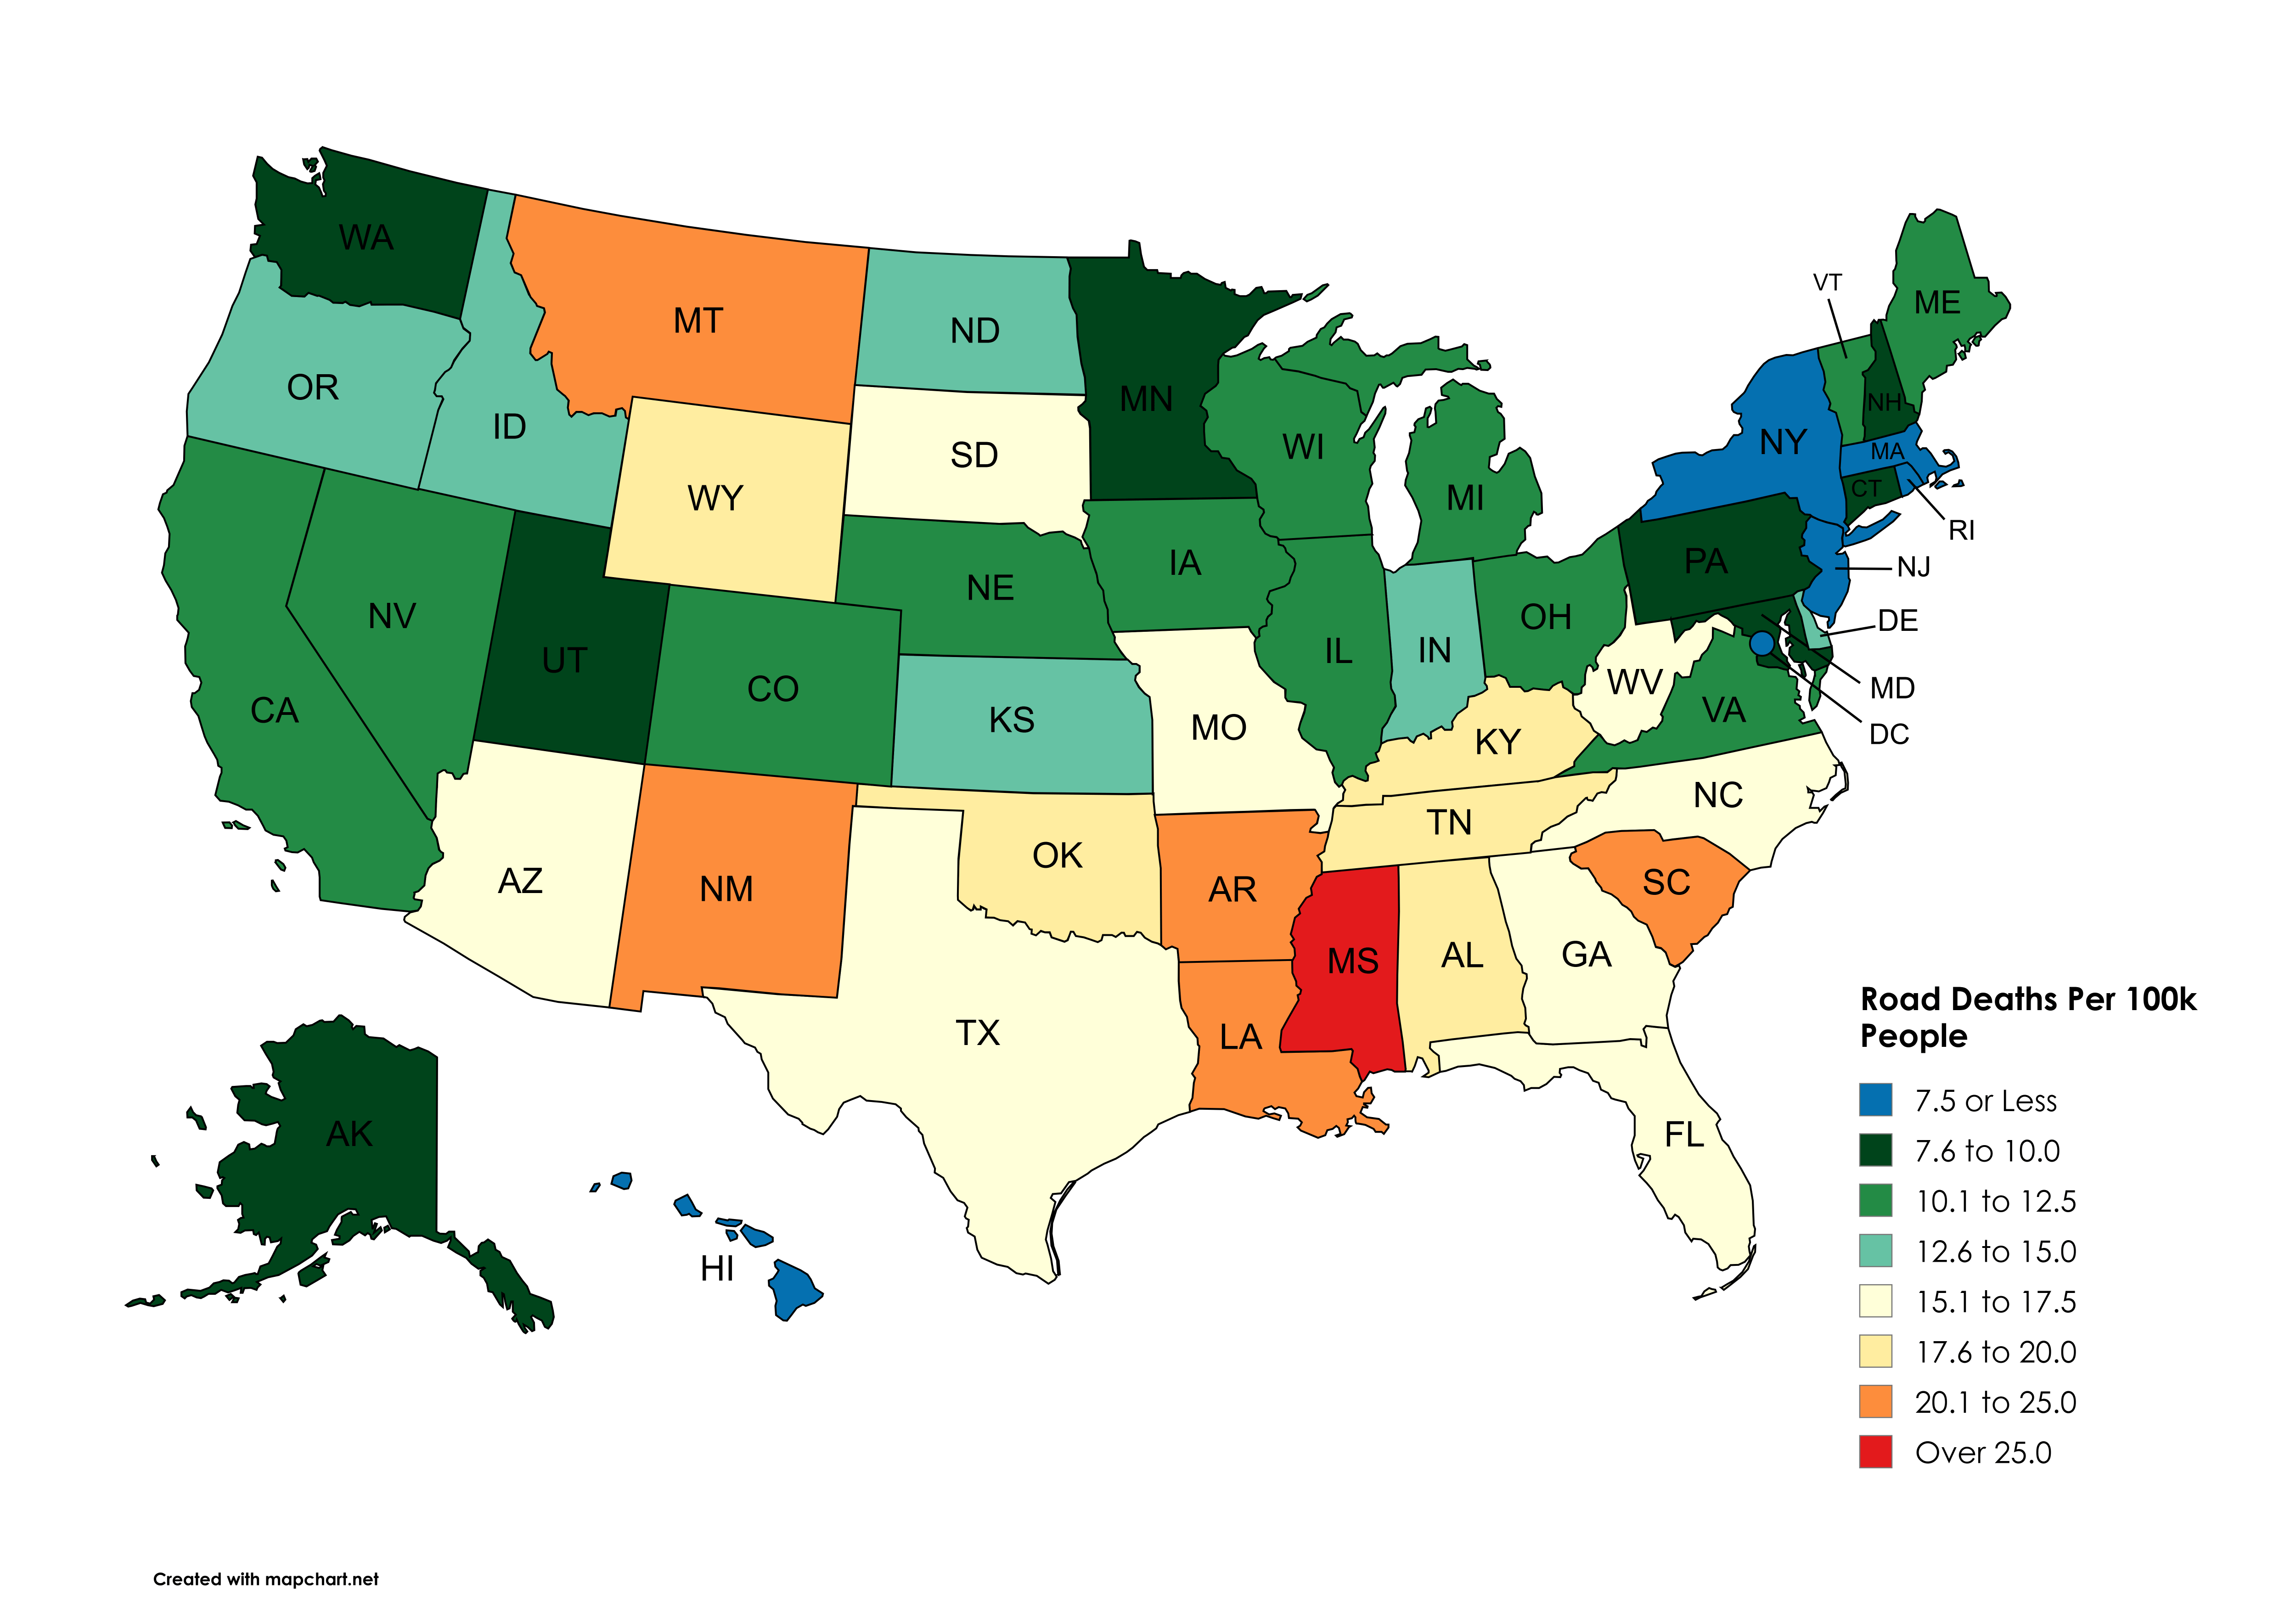
![[OC] Road Deaths Per 100k People by U.S. State (2021 Data From NHTSA)](https://www.europesays.com/wp-content/uploads/2025/05/uh8qynbn2tye1-1920x1024.png)
29 comments
What’s NY doing in terms of road safety?
+1 for mass having terrible traffic and a*hole drivers but low accidents
Aggressive is… Good?
Damn, Mississippi last in everything
Each time I see a map with datas by State, I wonder how Mississippians and Louisianians manage to survive.
This really needs to be normalized by miles driven by motor vehicles.
Why are the lightest colors in the middle range?
It’s amazing how closely this map correlates tonthe map of higher education levels.
This map sorta reflects urbanization.
More urbanized states have less need for driving between areas. Less wildlife to encounter. More healthcare areas accessible in case an injury occurs. Faster response time to crashes and wrecks (both reporting them, and actually reaching the injured with care).
There are nuances, but also this is just one years data. So that could explain some of that.
Upstate New York has an awful lot of traffic enforcement stationed on its 65-mile-per-hour freeways with design standards that beg for speed, then you get off and take side roads with blind unbanked hairpin turns and value-engineered guardrail placements. I don’t want to encourage any of that
Oh look, there’s Montana and its lax dui laws.
As an aside, some of those colors may be difficult for folks with protanopia type colorblindness to differentiate.
In Mississippi, you can drink while driving as long as you’re under the limit. You can drive with an open container of alcohol. I wonder if this correlates…
Any reason you didn’t use all greens?
Anyone from the DoT care to share the research on the causality of this data?
The are so many different overlays or XYZ where the Bible Belt is always lit up like a Christmas tree – education, poverty, income, homicides, etc. I’m starting to think it’s more than coincidence.
I’ve witnessed 2 terrible accidents in Montana, one was caused by a deer, the other an elk in a snow storm. Everyone else there knows someone killed by a drunk driver too.
New Jersey vindicated again.
This is 2021 data. So road deaths will be far lower in states that still had COVID restrictions (less driving to work/school) in addition to whatever else is causing this.
I see a lot of US maps of interesting stats and the one thing they all tell me is there is no way in hell I’d live in MS.
Now throw in Canadian provincial data.
Now do a compare and contrast this with fatalities per 100 million vehicle miles traveled. The link below is for 2022 data. For example, California is ranked 21st based on population but 32nd based on mileage and Indiana is ranked 29th based on population but 9th based on mileage. Rhode Island is tied for 1st in population and is also 1st based on mileage.
[https://www.iihs.org/topics/fatality-statistics/detail/state-by-state](https://www.iihs.org/topics/fatality-statistics/detail/state-by-state)
Is Mississippi ok? They seem to always have the worst scores in every data set.
Texas is usually ranked better than all its neighbors on these kinds of maps but I’m kind of shocked that holds up on this particular one
Okay now where’s the map of States with mandatory inspection laws
Honestly shocked by Utah and Washington.
Hard to die if you’re stuck going 15mph on 287.
Cumberland county most resembles the rural south, full of 4 way stop signs on 50mph roads, plus the countless memorials on RT55. But, the vast majority of us live in the NY metro area, and NJ is 23rd highest in 2022 for pedestrian deaths by auto per capita per NHTSA. We’re still consistently top 15 for states with highest premiums, and deservedly so.
Why is the south like that
I live in New Zealand, which is basically 99% winding two lane roads with single lane bridges, steep drop offs, and some of the most selfish, stupid, aggressive drivers on the planet. We’re 5.4 per 100k.
Europe:
https://preview.redd.it/32ufb7h9ttye1.jpeg?width=1179&format=pjpg&auto=webp&s=70661434c0862c5cfaf829dc8b8144b3cb5a5ef7
Rather see it by miles driven. NY is so low because NYC has a huge population that mostly doesn’t drive.
Comments are closed.