I crunched the latest official numbers about UK salaries. Here some interesting findings:
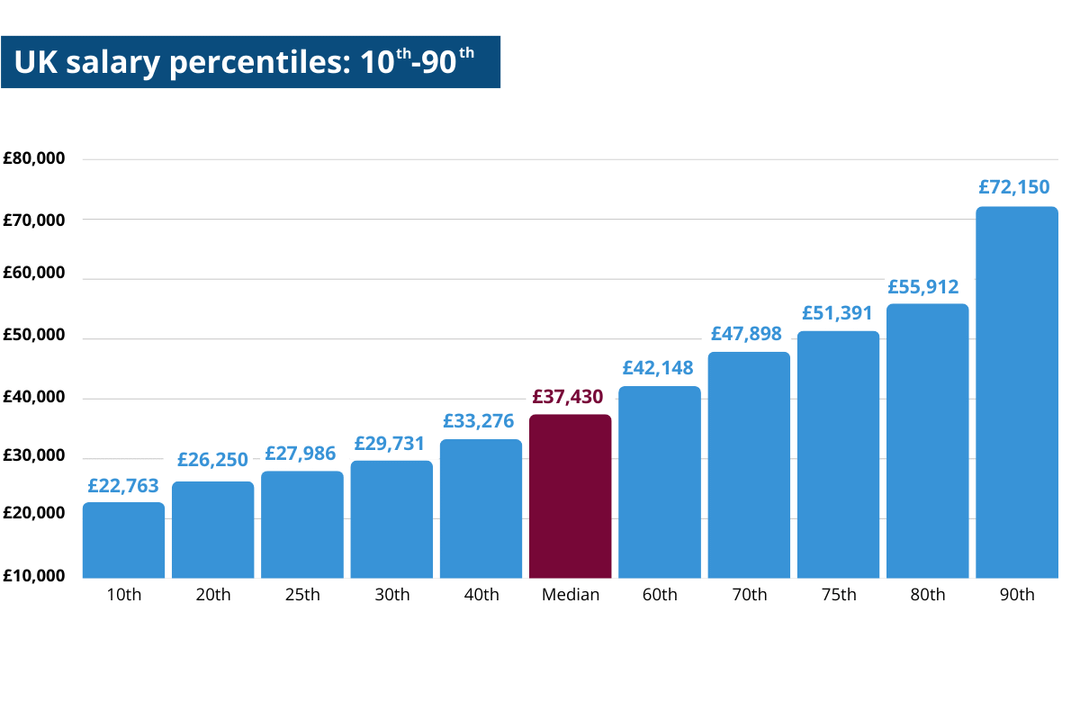
- 80% of people in the UK earn between £22,763 and £72,150 (10th and 90th percentile)
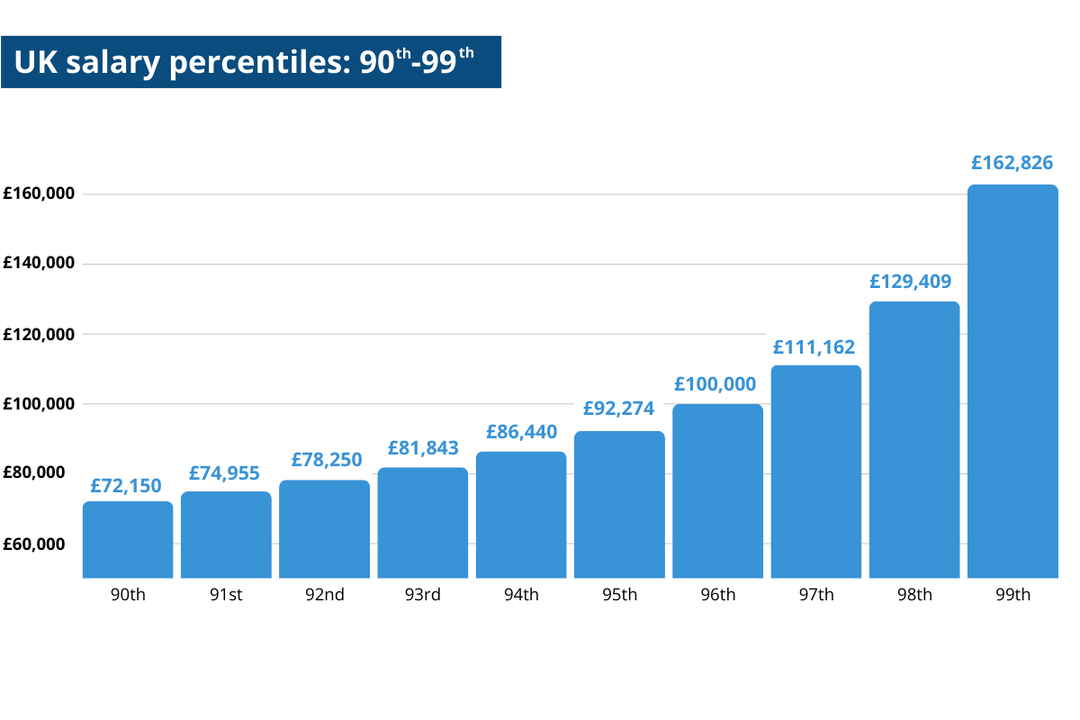
- The difference between the 10th and 20th percentile is £3,487. The difference between the 90th and 99th percentile is £90,676.
- If you just make a six-figure salary (i.e. you earn £100,000), you're paid more than 96% of people in the UK
- The median salary (£37,430) is 110% higher than it was in 2000 (£17,803). Inflation over the same time period was 87%.
- The US median salary of $50,200 is almost exactly the same as the UK median salary (£37,430) after currency conversion. However, the 90th percentile in the US ($150,000) is more than 1.5x the 90th percentile in the UK (£72,150).
Data source: Office of National Statistics – all data refers to gross, full-time salaries. For US comparisons in last bullet, data comes from here.
Full analysis: https://thesalarysphere.com/blog/average-salary-uk/
Posted by paddyrobby
14 comments
**Data source:** [Office of National Statistics](https://www.ons.gov.uk/employmentandlabourmarket/peopleinwork/earningsandworkinghours/bulletins/annualsurveyofhoursandearnings/2024/relateddata) – all data refers to gross, full-time salaries. For US comparisons in last bullet, data comes from [here](https://dqydj.com/average-median-top-individual-income-percentiles/).
**Full analysis:** [https://thesalarysphere.com/blog/average-salary-uk/](https://thesalarysphere.com/blog/average-salary-uk/)
**Tool used for visualisation:** Canva
Does this include pension or just taxable earnings?
I earn the exact median, but I’m in Norway 😭
Interesting stuff.
In the linked article, I think you’ve got the averages the wrong way around:
“The 2 principal measures of an “average” are the median and the mean.
When looking at the average salary in the UK, the former results from adding up all salaries and dividing them by the number of (working) people. The latter results from looking at the mid-point of all salaries, i.e. the salary at which 50% of the population earn more and 50% earn less.”
When you’re in the 98th percentile, but still feel like it’s not enough…..
Hey is this after tax or before tax?
That’s not a lot considering the high income taxes…
What I’d be curious to know is how much of their salary does the average US worker have to pay to get health insurance.
I know in the UK I pay 11% of my salary in National Insurance and I get free health care for myself, my wife and my kids.
I’m guessing Americans would pay a LOT more to get cover for not only themselves, but their wife and kids. And I’ve not doubt that they’ll pay even more of anyone has medical conditions such as type 1 diabetes or cancer but I really don’t know.
People always underestimate the skew in the distribution of incomes in this country. It pissed me off during the debate on adding VAT to school fees when people implied that anyone earning more than the average had essentially unlimited funds to cover the extra tax. From this data you can see that someone earning at the 90th percentile is closer to the median income than they are to someone earning at the 97th percentile.
Oof I’m below the median that’s rough. Time to get back on the grind I guess. Good luck to everyone
Are wages from people working in London not an outlier in the data?
Currency conversion isn’t a very good comparison. Instead use PPP purchasing power parity as its a comparison between quality of life on said incomes
This should be split between London vs rest of the country
Curious as to how does this look like in London specifically. Does the ONS have data by geographic region?
Comments are closed.