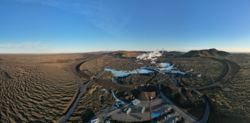
Protective barriers surrounding the Svartsengi area in early November 2024. (Photo: The Icelandic Met Office / Bjarki Kaldalóns Friis)
Update 6. MayUplift in Svartsengi continues, although the
rate has slowly decreasedBased on the rate of magma accumulation in
recent weeks, the likelihood of a new eruption increases as autumn approachesSeismic activity along the dike has decreasedThe hazard assessment map has been updated and
remains valid until May 20, unless conditions change
Deformation
data (GPS) show clear signs of ongoing uplift in Svartsengi, although its rate
has slowed in recent weeks. Scientists have assessed when the likelihood of a
new magma intrusion or eruption might increase. This assessment assumes that
the same amount of magma must accumulate beneath Svartsengi as in previous
events in the Sundhnúkur crater row. If the uplift continues at the same rate as
today, the likelihood of a new dike or eruption is expected to increase as autumn
approaches. However, if the rate of uplift, and thus the magma accumulation
under Svartsengi, changes, it will affect this assessment.
Scientists
at the Icelandic Meteorological Office are now revising the potential scenarios
and are evaluating, among other things, the amount of magma beneath Svartsengi necessary
to trigger a new dike or even an eruption.
Changes in uplift rate assessed
over weeks rather than days
Deformation
data showing uplift often fluctuate slightly from day to day, even if the
underlying magma inflow is steady. These daily variations can be caused by
weather, measurement errors, or other natural factors that have little impact
on the overall picture. Looking only at short time periods may give a
misleading impression of whether uplift is increasing or decreasing. Therefore,
it is important to analyze trends over a week or longer to get a realistic view
of what is happening. It is crucial to interpret these data in the context of
longer-term trends rather than focusing on measurements from individual daily GPS
measurements.
Seismic
activity continues along the dike that was formed on April 1, but activity has
decreased since the end of the eruption. On average, several dozen earthquakes
have been recorded per day over the past two weeks.
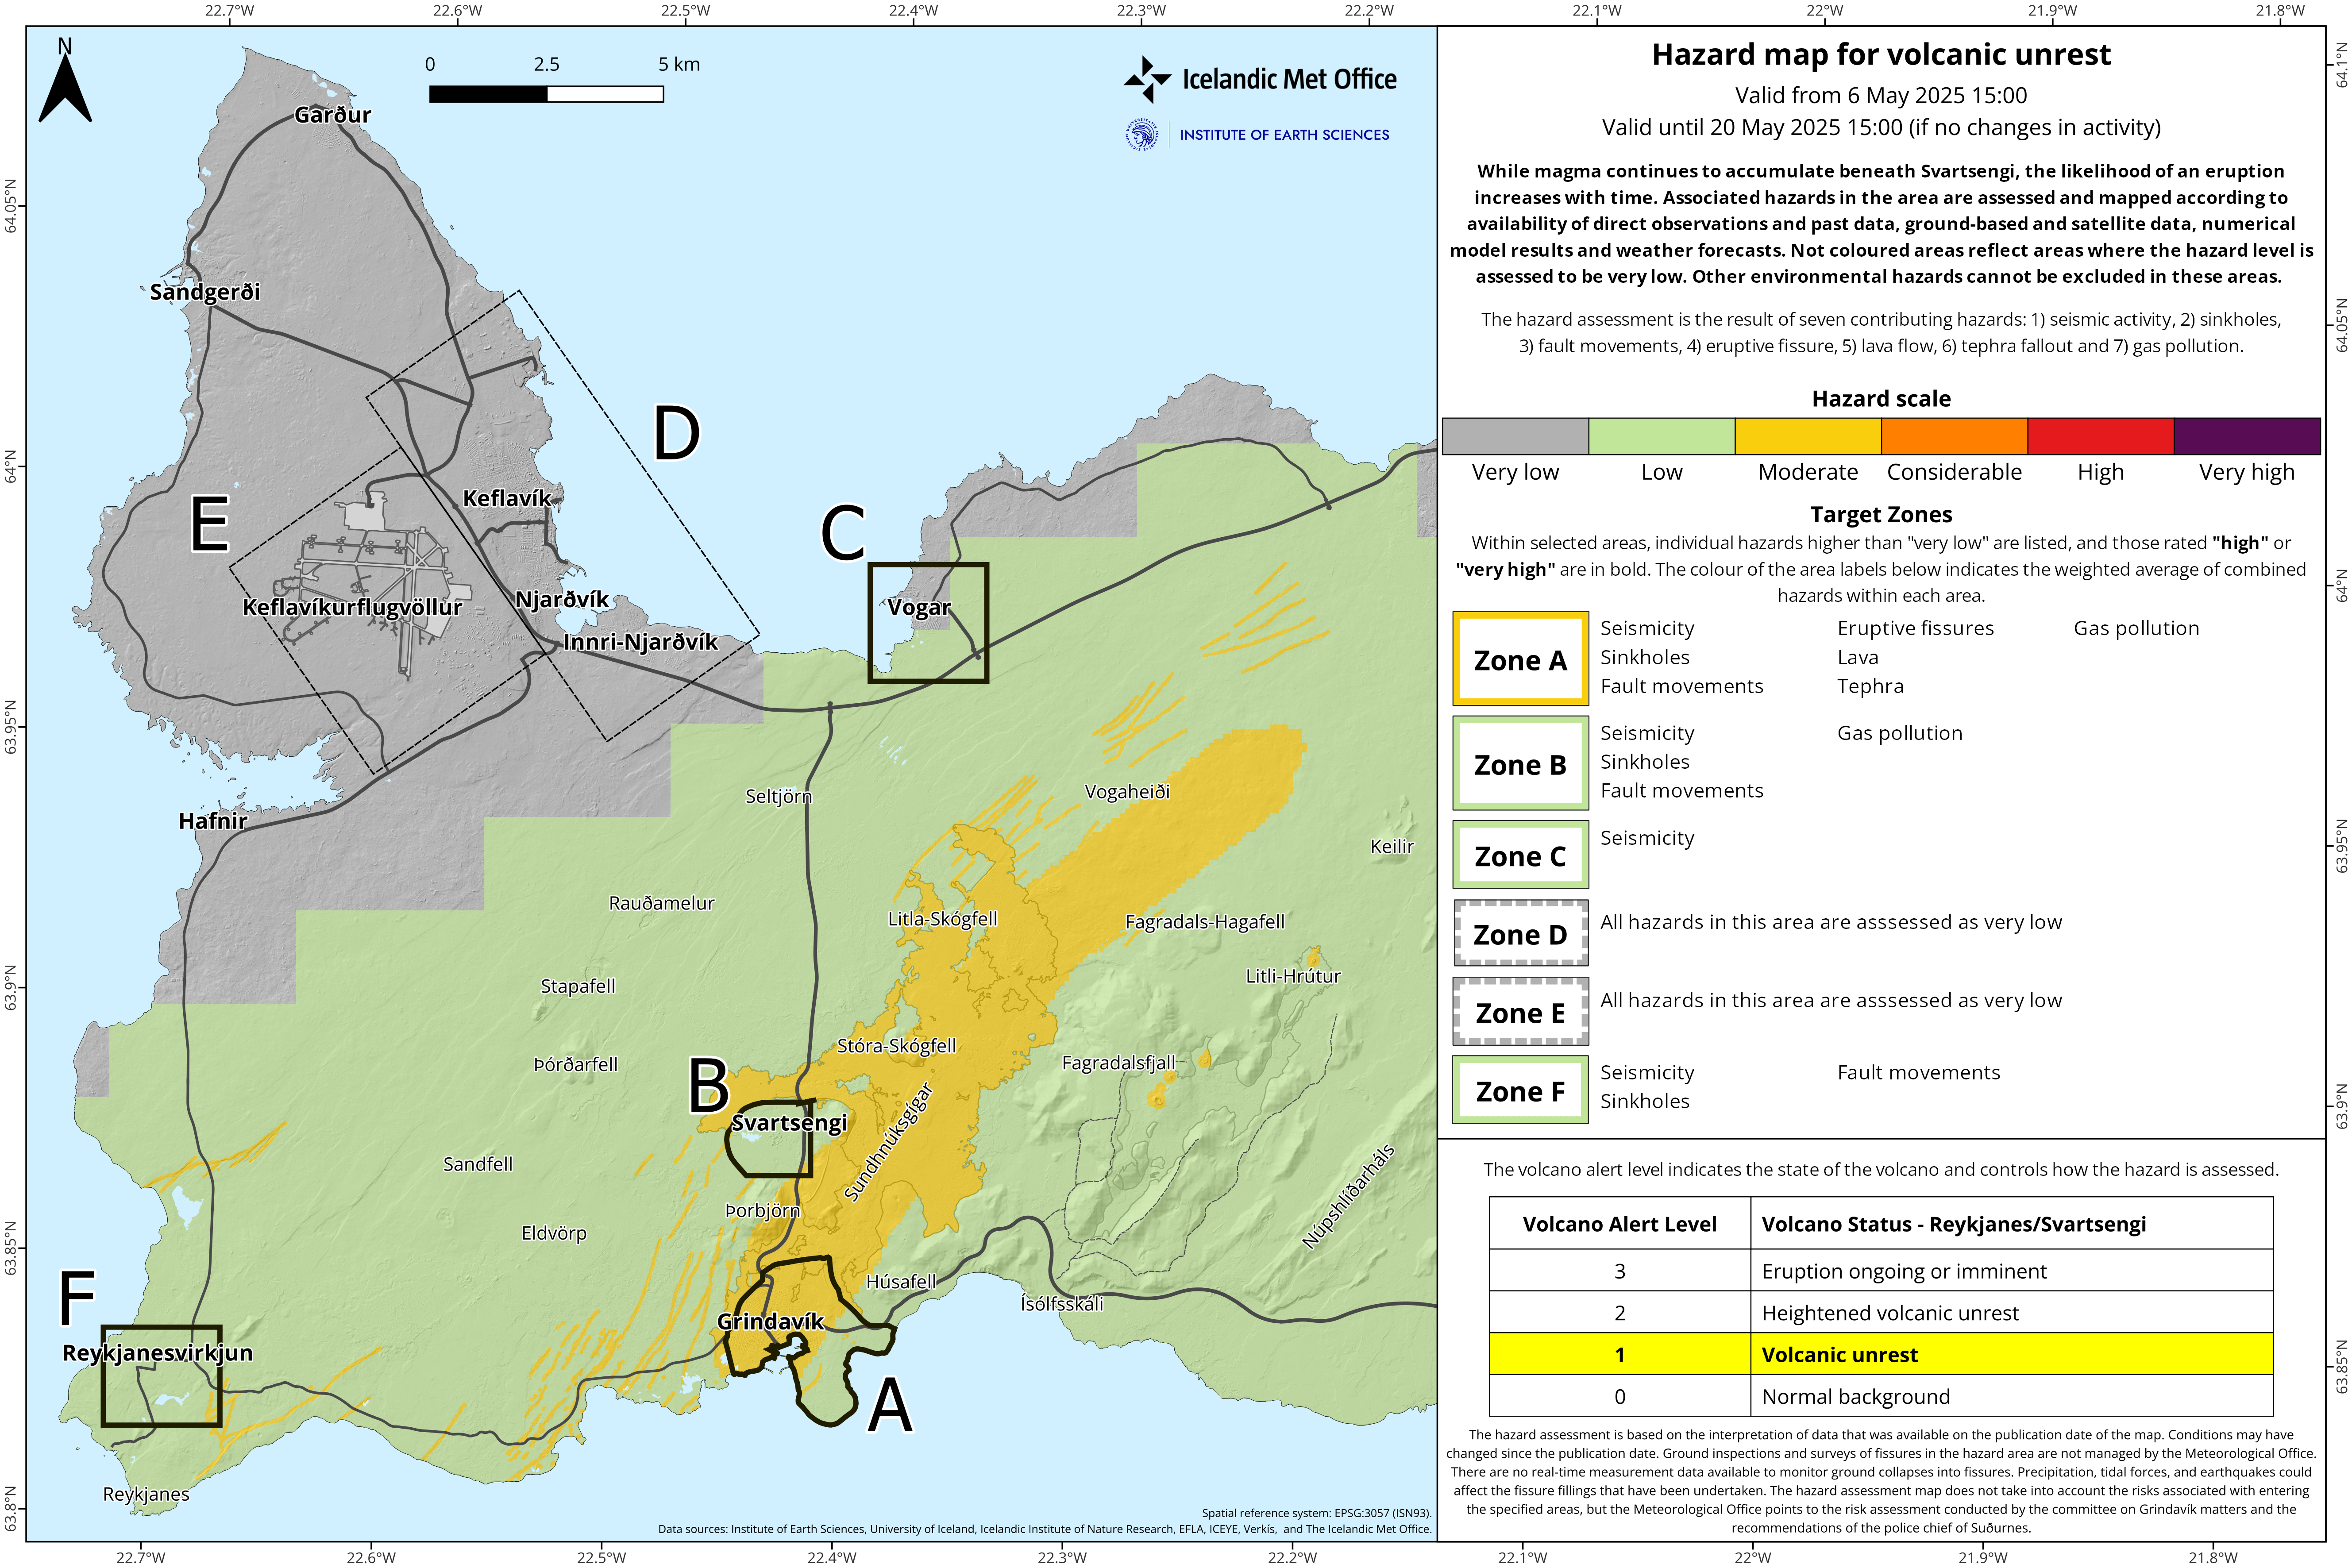
The hazard assessment map has been updated and
remains valid until May 20, unless changes occur. A new information update is
also planned for May 20.
Update 22. April kl. 12:30 UTC
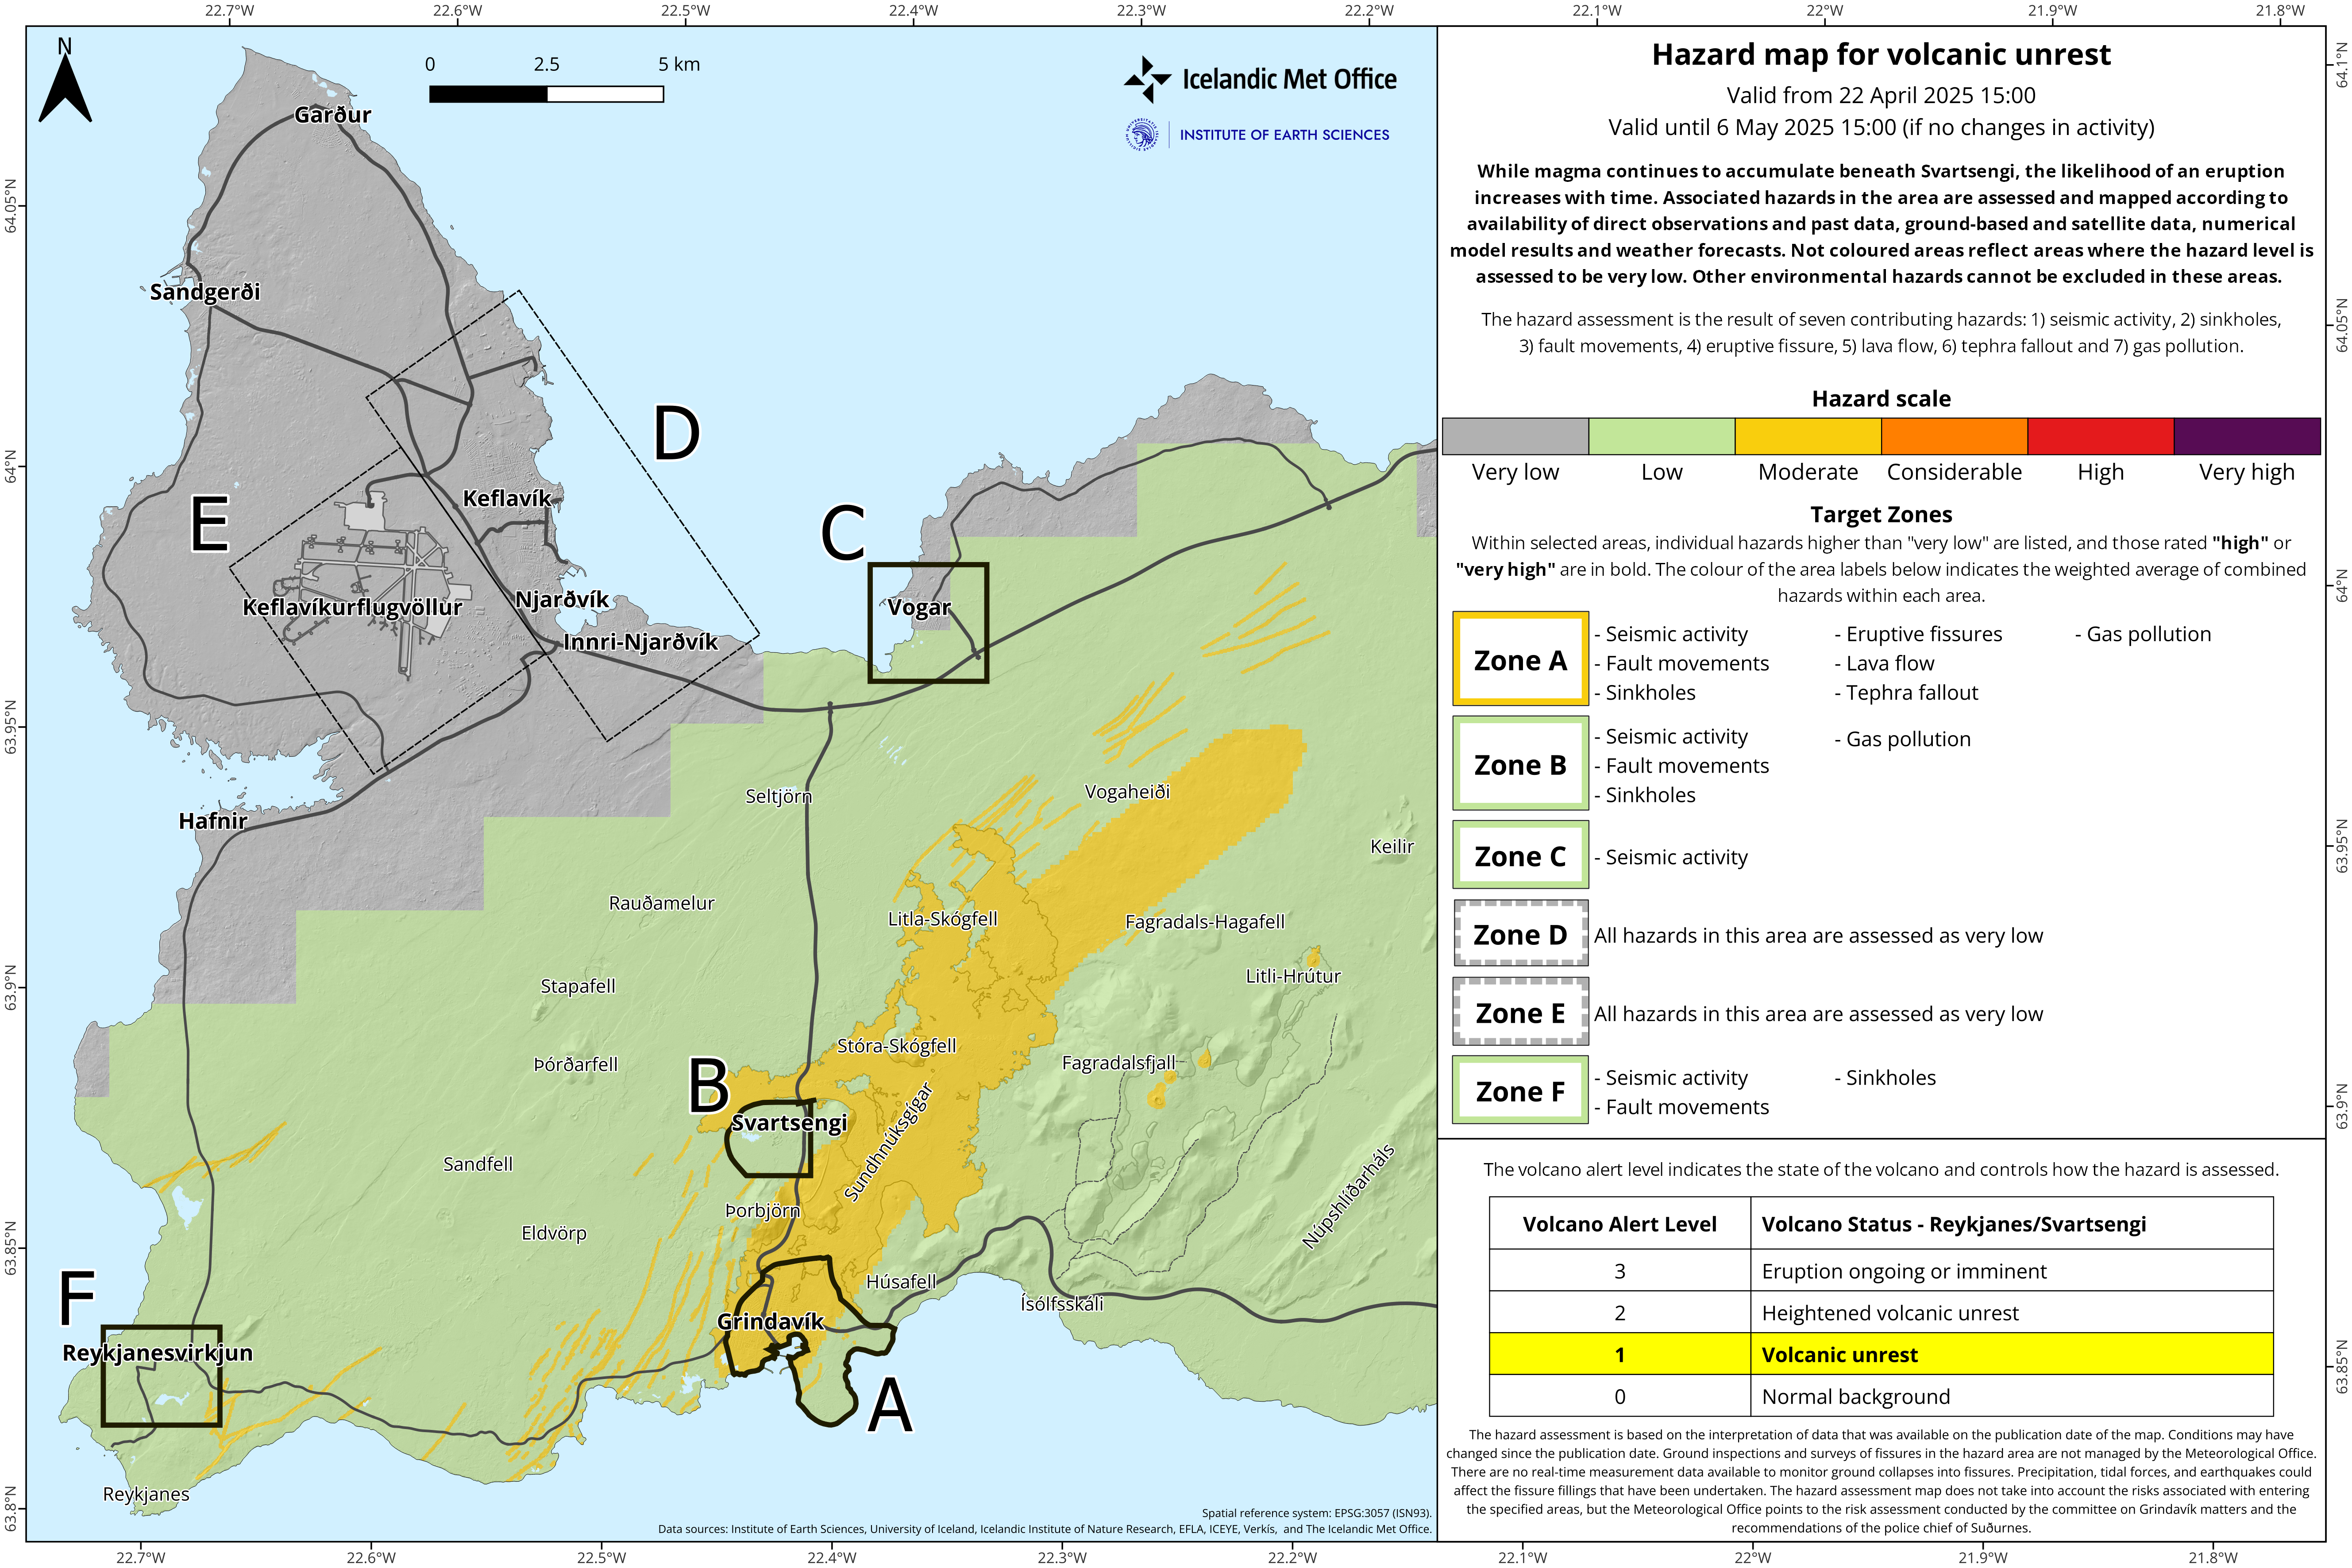
Considerable micro-earthquake activity is still being recorded near the dike intrusion
The hazard assessment has been updated and is valid until May 6, assuming no changes
Uplift in Svartsengi continues, but the rate
has significantly decreased and is now similar to the period before the
eruption that began on April 1. As magma accumulation continues beneath
Svartsengi, repeated magma intrusions and even eruptions in the Sundhnúkur
crater row must be considered.
The Icelandic Meteorological Office continues
to monitor the development of magma accumulation and assess possible scenarios
based on the latest data.
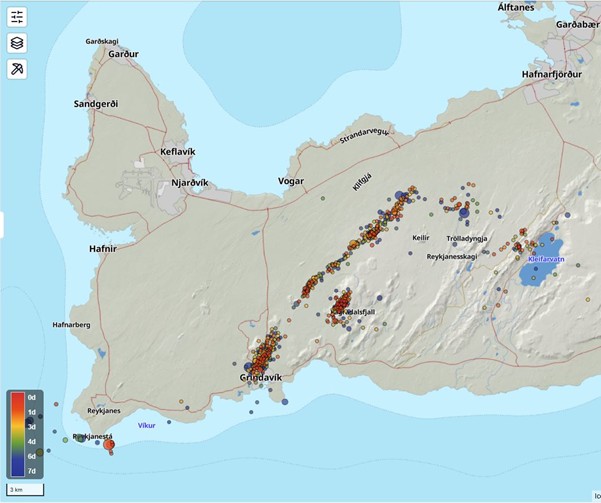
The map shows reviewed earthquakes on the Reykjanes
Peninsula over the past week. Most of the earthquakes were located near the
magma intrusion that was formed on April 1st and in the western part of
Fagradalsfjall. The color differences of the points indicate the timing of the
earthquakes, with the reddish points marking earthquakes that happened in the
past day and the blue ones about a week ago.
Micro-earthquake
activity continues near the magma intrusion that formed on April 1, with an
average of about one hundred earthquakes per day in the past week. Most of the
earthquakes are below magnitude 1, with the largest one recorded at magnitude
1.7 during the past week. There was also some minor earthquake activity near
Fagradalsfjall last weekend. Calm weather in recent days has allowed the
monitoring network to detect even the smallest earthquakes that would otherwise
likely not be recorded due to weather noise.
The hazard map has been updated and is valid
until May 6th, assuming no changes.
News update 15. April
The rate of deformation at Svartsengi has
decreasedSeismic activity over the dike intrusion is
decliningA new version of the hazard assessment map
takes effect today, April 15
Minor seismic activity
is still being recorded around the dike intrusion that formed on April 1, with
dozens of earthquakes occurring daily in the area. The largest earthquake over
the past week was a magnitude 3.3 on April 13, located over the northern part
of the dike intrusion, about 4 km ENE of Keilir. Most of the earthquakes are
under magnitude 2 and at depths of 2 to 6 km.
Uplift at Svartsengi continues, though the
rate has slowed compared to last week. The current rate is about twice as fast
as it was just before the last eruption, and is similar to the rate observed at
the start of the current eruption cycle that began in 2024.
The Icelandic Meteorological Office continues
to monitor the area, track magma accumulation, and assess possible scenarios
based on the latest data. As long as magma continues to accumulate beneath
Svartsengi, repeated magma intrusions and even eruptions along the Sundhnúkur
crater row must be considered possible.
New hazard map covering a
larger area
Today, a new version of a hazard map is published and distributed by the Icelandic Meteorological
Office to inform and report on the level of hazard due to the ongoing unrest in
the Reykjanes peninsula. This map replaces the previous hazard map that has
been in use and published since November 2023, which showed hazard assessments
for seven well-defined zones near the activity around the Sundhnúkur crater
row.
The seven-zone map has been updated and issued
108 times since November 20, 2023. While it had its strengths, its limitations
included difficulty in assessing hazards outside the defined zones.
Recent developments on
the peninsula, where a magma intrusion formed and reached the northeastern part
of the Svartsengi volcanic system on April 1, 2025, and an eruption that
occurred west of the northernmost part of Fagradalsfjall in August 2024,
highlight the need for a hazard assessment that covers a larger area.
A new map has
therefore been developed to address the limitations of the previous version.
This new approach is not only applicable to the Reykjanes Peninsula but also
introduces a methodology that can be used for all other active volcanic systems
in Iceland.
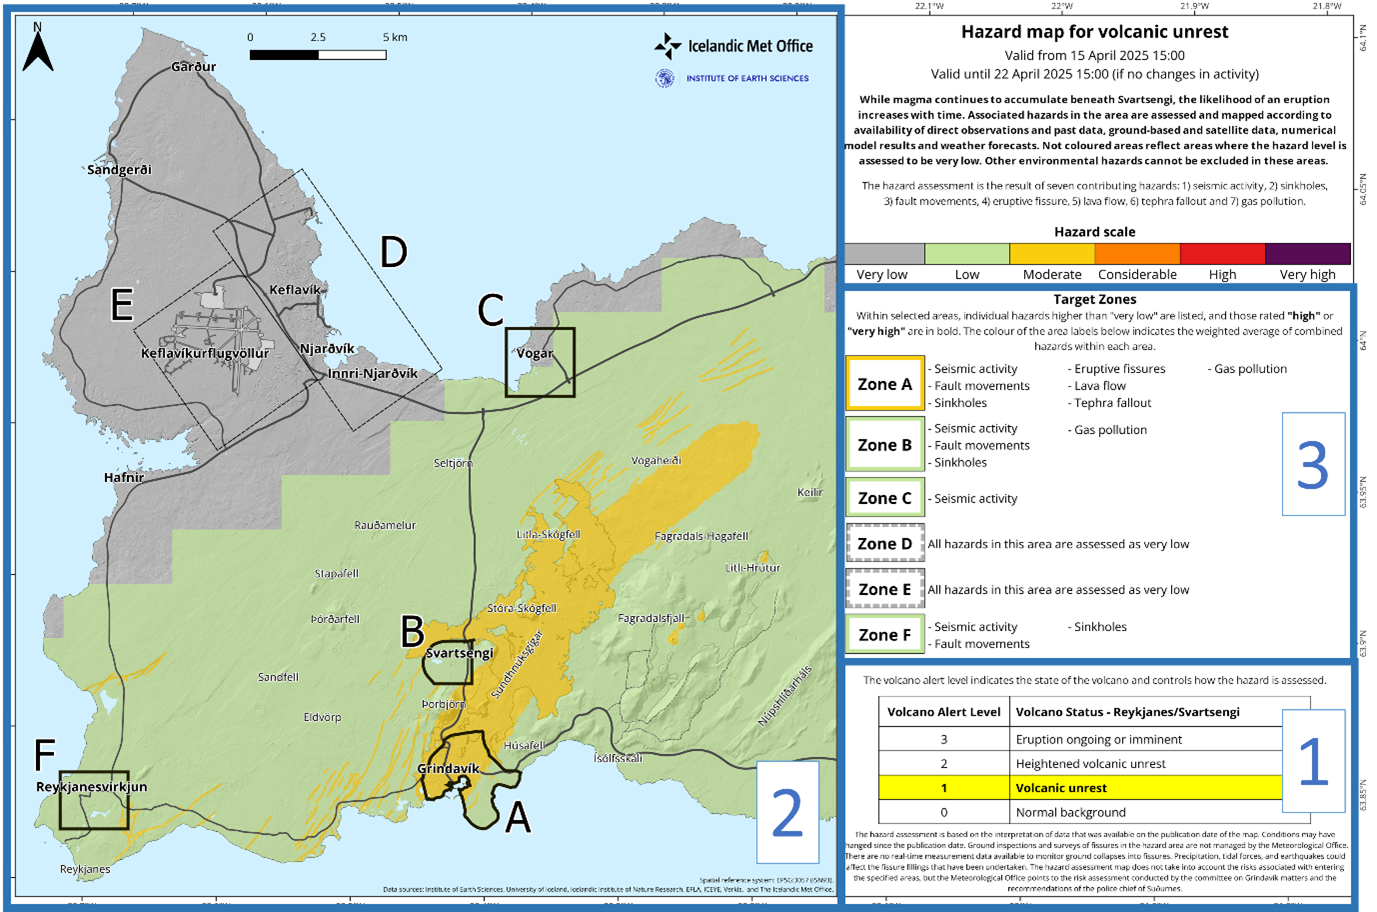
Layout
and presentation of the new hazard map, replacing the seven-zone map as of
April 15, 2025.
New features include: 1. Volcanic alert
level system (see blue box 1), expanded mapped hazard area (see blue box 2)
and target zones (see blue box 3). See further details in the
accompanying text.
The hazard map is based on three componentsThere are three major updates in the new map:
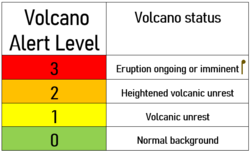 1. Volcanic Alert Level – This reflects the current status of the volcanic system and uses a four-tier color-coded scale from 0 (green) to 3 (red).
The alert level indicates the status of the volcanic system and determines how the hazard is assessed.
 2. Mapped Hazards – The assessment is based on a combined evaluation of seven hazards that are present or may arise: 1) seismic activity, 2) sinkholes, 3) fault movements, 4) eruptive fissure, 5) lava flow, 6) tephra fallout, 7) gas pollution. Each location within the domain shows the cumulative level of hazard according to the volcano status. The shapes and sizes of these areas may change depending on the evaluated hazard at any given time.
 3. Target Zones – Once the different hazards are
estimated, the averaged hazard level is calculated within pre-selected target
zones. For these zones, hazards contributing to the final hazard level are
listed and described. The size and shape of these target zones
remain fixed, even if their hazard levels may change with time.