I wanted to see what impact the degree of a community's political homogeneity — which I claim is also a measure of a community's political extremism — has on various measures of health.
I found that:
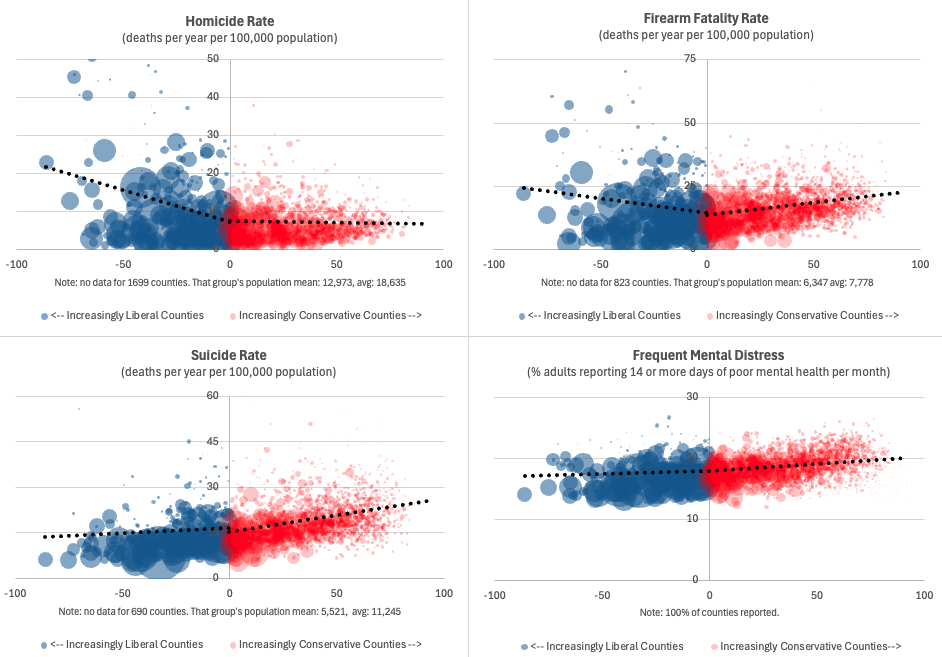
- As counties become more conservative, homicide rates drop slightly, but increase sharply as a county becomes more liberal.
- Increasingly liberal counties have lower suicide rates while they increase substantially as counties become more conservative.
- Firearm fatality rates increase with political extremism among both liberal and conservative counties. I cannot rule out that some suicides will also be counted as firearm fatalities.
- Frequency of mental distress is lowest in more liberal counties and increases steadily as communities increase in conservatism.
Differences in homicide rates are likely a function of larger population centers being home to more liberals and violent crime.
I hypothesize that the increasing rates of suicide and gun violence are correlated in conservative counties but not liberal ones because of the presumably greater access to firearms in rural, conservative homes; and that increased mental distress among the more conservative contributes to that trend.
Mental distress may increase with conservatism as a result of the relative lack of mental health resources available to rural populations. This may also contribute to the increased prevalence of suicide among the increasingly conservative.
Method
I measure political extremism by the degree of victory of Trump or Harris in 2024, subtracting Harris' percent won from Trump's, producing in a number between +/- 0 and 100 — the greater the absolute value, the more politically extreme the county and its communities. That data can be found here.
County-level measures of health are compiled and published annually by the University of Wisconsin's Population Health Institute. Find them here.
There are two trendlines because I treat left/right as distinct populations in order to observe their trends separately.
This was all done in Excel. If you're going to groan about Excel. at least also recommended an alternative.
Posted by JaraSangHisSong
13 comments
Honestly, all of those make perfect sense.
The mental distress is the most fascinating part of this for me. Many people talk about how being in the outdoors, away from the hustle and bustle of the city is good for their mindsets and attitudes, and there’s scientific basis for that. Having lived in the biggest cities in my state, and in towns with ~100 people total, the major issue I see for people in rural areas is lack of income, which I bet contributes heavily to mental distress. They are stressed about their homes, transportation, work – basically everything.
What about the people in those counties that don’t vote?
Did you do a descriptive analysis on the variables? I feel like a proper one would fix the graphs
This is likely an urban vs rural divide than a political one.
How can the x axis be negative?
It looks like you’ve made a handy confirmation bias generator
I’d be quite curious what the correlation coefficients on these are, they seem kinda terrible.
> what impact
Is not an impact, it’s a correlation.
You need to control for age, gender and income
dumb. correlation doesn’t equal causation
https://preview.redd.it/m5ghdtym0ize1.jpeg?width=1170&format=pjpg&auto=webp&s=935c726c1d5e47d1825a96786ea5b7829f0ae4ff
[https://www.tylervigen.com/spurious-correlations](https://www.tylervigen.com/spurious-correlations)
I love the smell of stoking political division in the morning.
Interesting how the independent trend lines always seem to intercept on the vertical axis. Dead center. Neat.
Comments are closed.