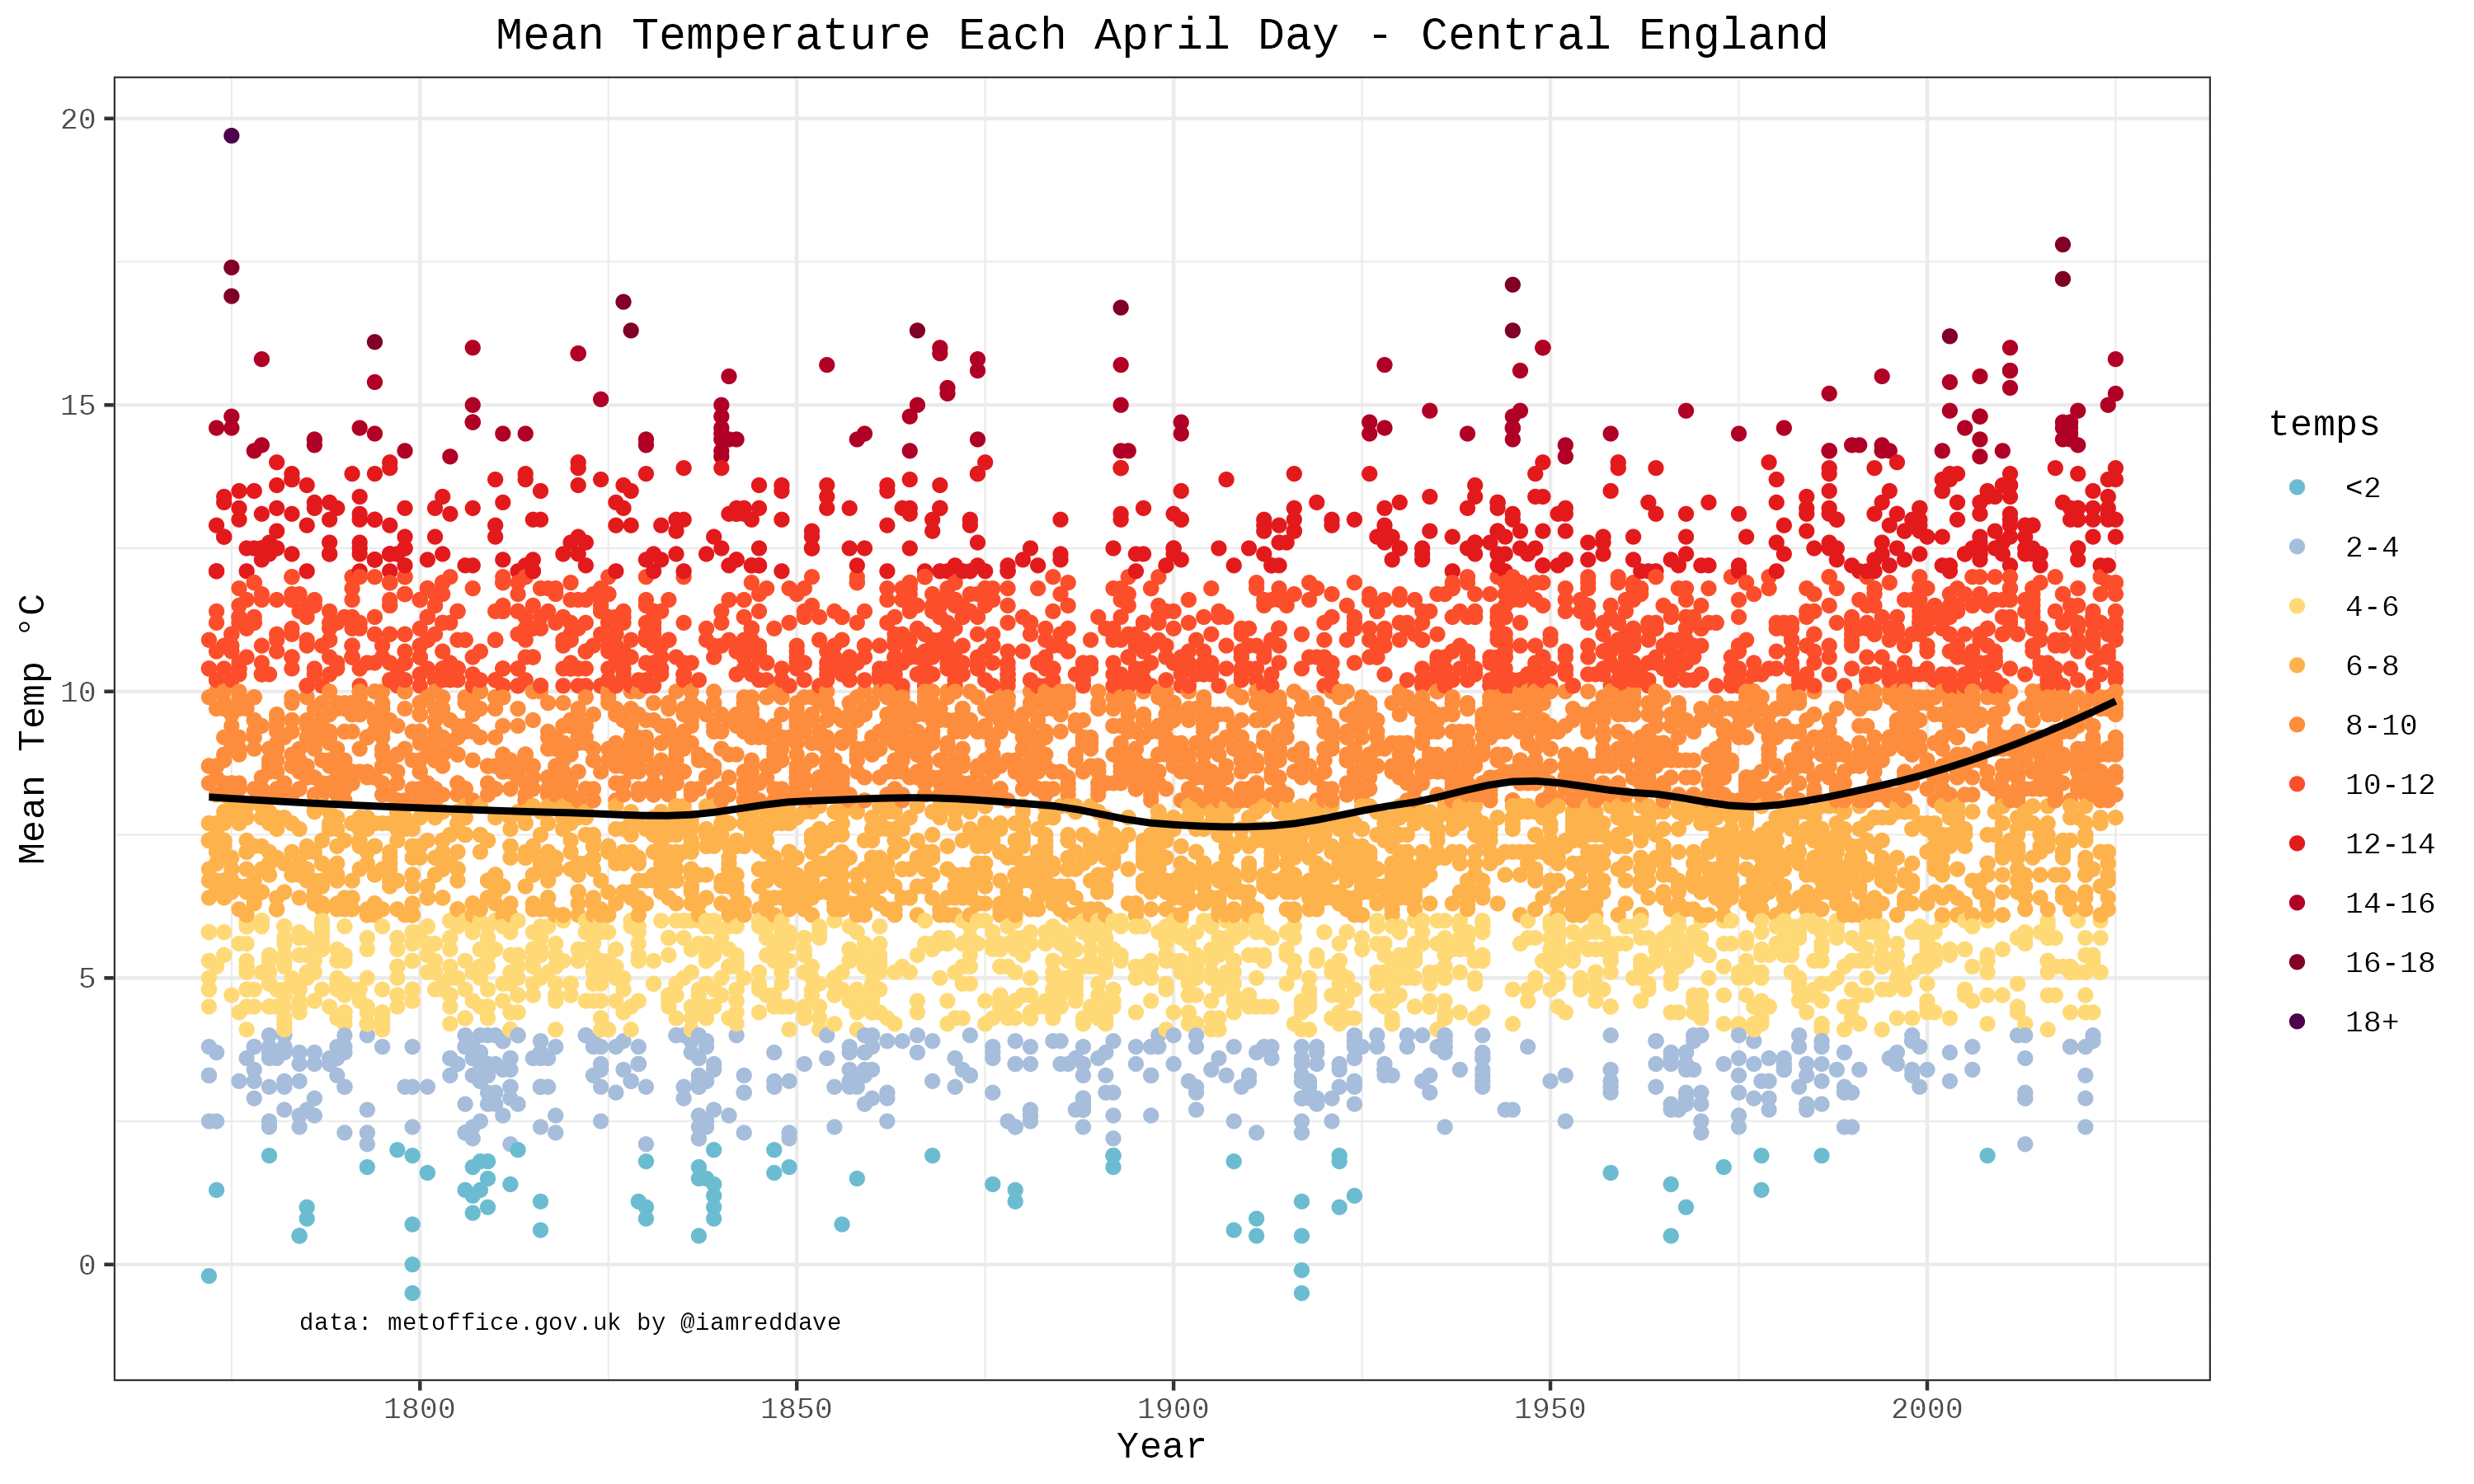
![Central England Temperatures Each April Day since 1772 [OC]](https://www.europesays.com/wp-content/uploads/2025/05/yf877jvdzjze1-1920x1024.png)
Ggplot r package code at https://colab.research.google.com/gist/cavedave/ed85e1291462c7a47a5bfd7ea1c3963b/may1st.ipynb
data at https://www.metoffice.gov.uk/hadobs/hadcet/data/download.html
Someone was arguing with me that the 'Hottest Labor day' since records began was a con as Labor day was only first celebrated in the UK in 1978. But it was actually the hottest (according to this dataset) going back to 1772
Date Temp
<date> <dbl>
1 2025-05-01 16.4
2 2005-05-01 16.1
3 1990-05-01 16
4 1958-05-01 15.9
5 1827-05-01 15.4
6 1908-05-01 15.3
7 1966-05-01 15.3
8 1788-05-01 15.2
9 1804-05-01 15.2
10 1807-05-01 15.2
Posted by cavedave
9 comments
Its gettin hot in here (so hot)
So take off all your clothes
I am gettin so hot, I wanna take my clothes off
Why are there so many points? Each point a different location? Average laid over all locations in central England?
So where are the temperature readings from 1772 coming from? How reliable are they?
Data is ~~beautiful~~ anxiety inducing
Do [the rules](https://www.reddit.com/r/dataisbeautiful/comments/1k11wbf/comment/mnjha7t/) not apply to cavedave?
Ggplot r package code at [https://colab.research.google.com/gist/cavedave/ed85e1291462c7a47a5bfd7ea1c3963b/may1st.ipynb](https://colab.research.google.com/gist/cavedave/ed85e1291462c7a47a5bfd7ea1c3963b/may1st.ipynb)
data at [https://www.metoffice.gov.uk/hadobs/hadcet/data/download.html](https://www.metoffice.gov.uk/hadobs/hadcet/data/download.html)
like i said in the submission statement.
>the ‘Hottest Labor day’
You’re bound to confuse a couple of people with the American spelling. Labor Day in the US is on 1 September, while Labour Day in the UK (and in most of the world) is on 1 May.
You can see the 1940-1975 temperature decline that is the reason for the mid 1970s articles about ‘the coming ice age’ that the climate deniers keep talking about.
Followed by the last 50 years of temperature increase
Our solar panels generated more in April 2025 than they did in any single month of 2024. Crazy.
Comments are closed.