How dare this not support the currently pushed narrative!
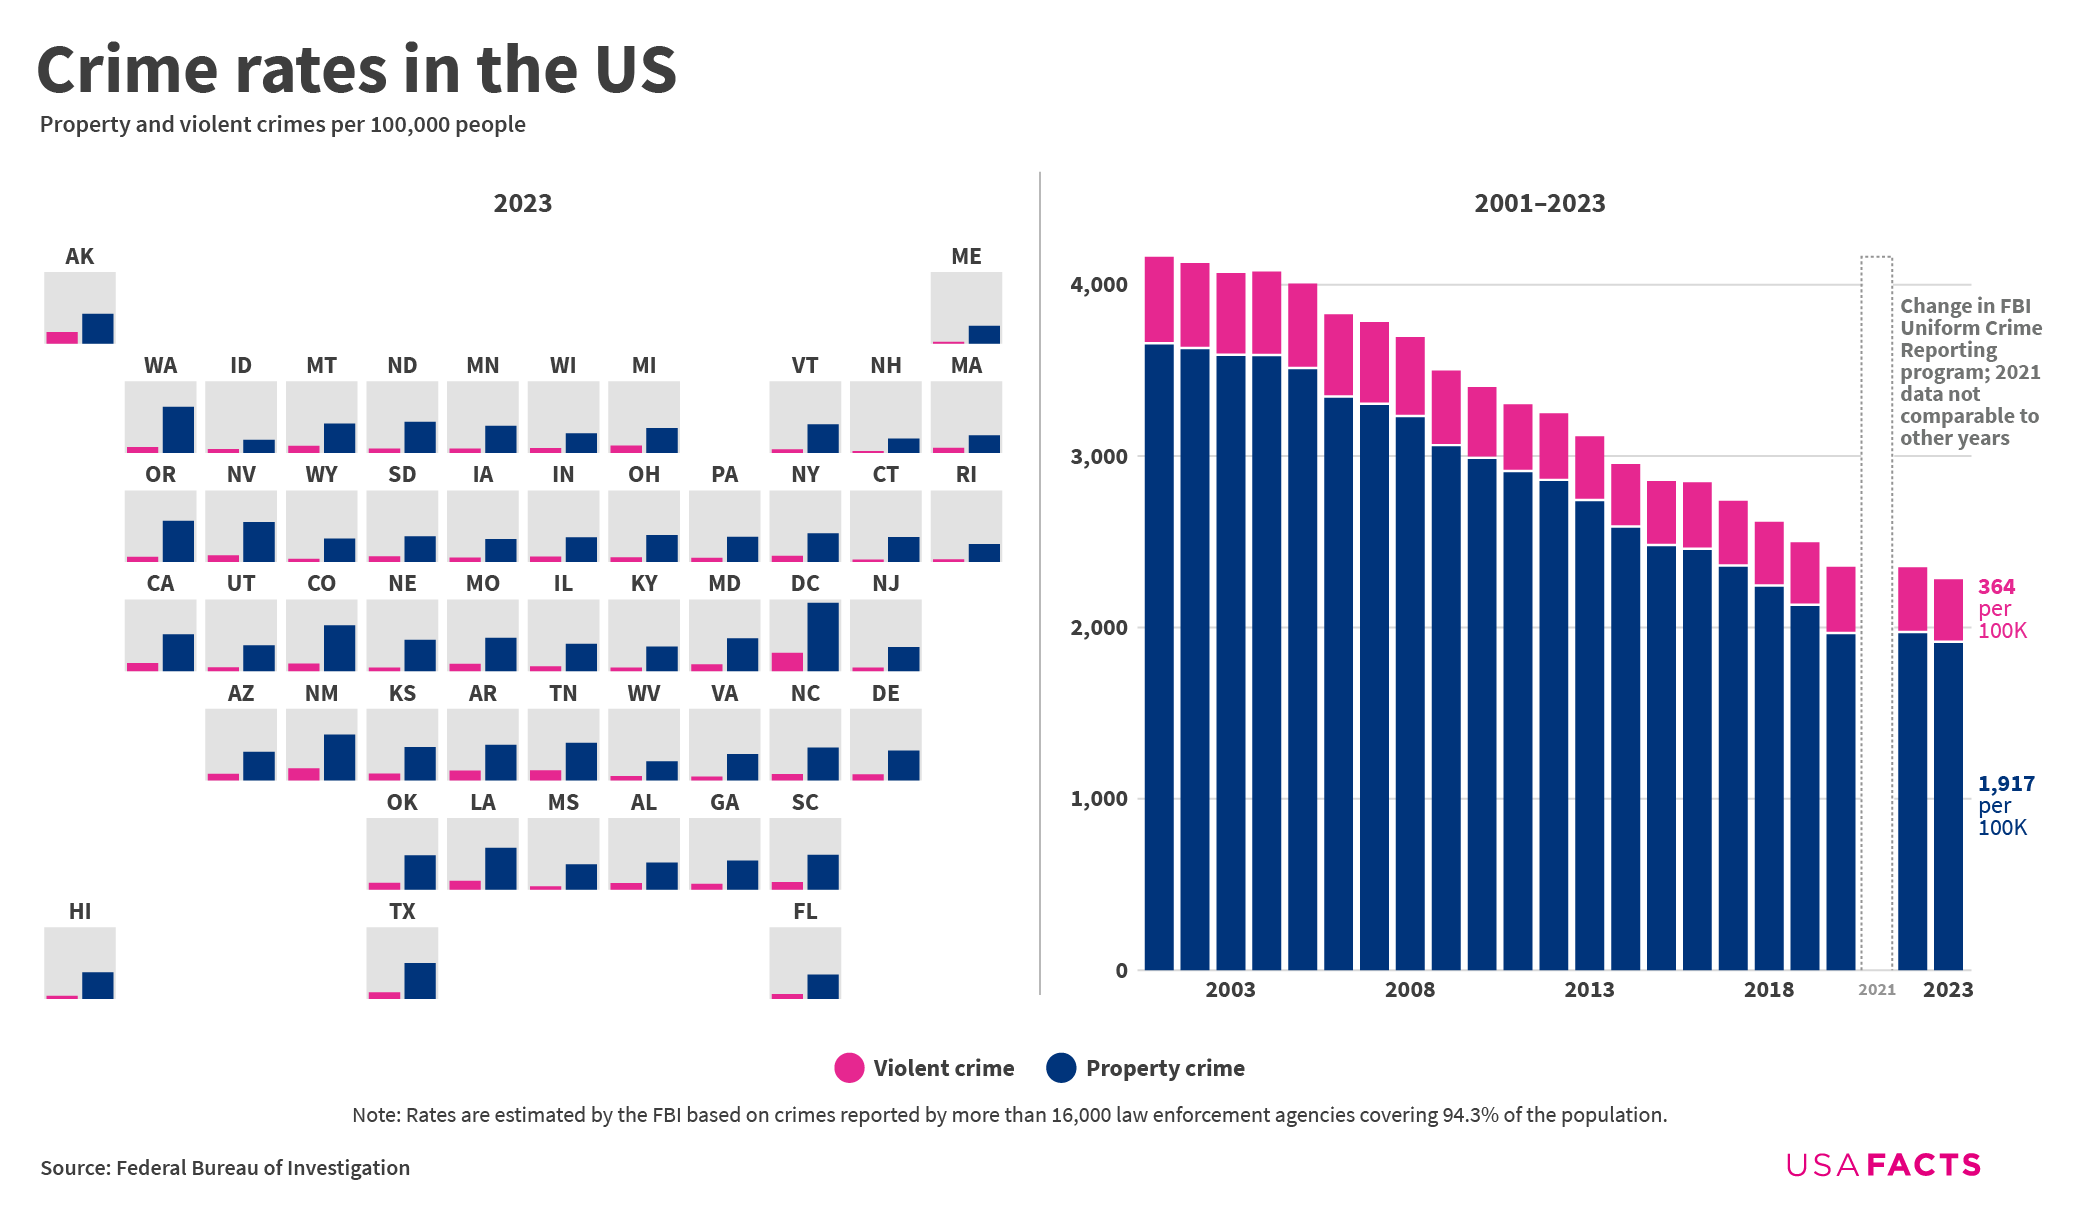
In 2023, for every 100,000 people in the US, there were 364 violent crimes and 1,917 property crimes. The combined violent and property crime rate fell 3% from 2022, driven by a 3.5% decrease in the violent crime rate and a 2.9% decrease in the property crime rate. Since 2001, that overall crime rate is down 45.2%.
Assault is the most common type of violent crime in the US. In 2023, 72.6% of all violent crimes were aggravated assaults, 18.3% were robberies; 7.5% were rapes, and 1.6% were murders.
Stealing (technically called “larceny-theft” by the FBI) is the most common property crime. In 2023, 70.3% of all property crimes were larceny-thefts, 16.6% were motor vehicle thefts, and 13.1% were burglaries.
At the state level, New Mexico had both the highest violent crime rate (749) and property crime rate (2,887) in 2023. Maine (102) had the lowest violent crime rate and Idaho (809) had the lowest.
Although it’s not a state, the FBI also provides data for Washington, DC, which had a violent crime rate of 1,151 and a property crime rate of 4,307.
The longer time goes on, the more I like the “lead paint/leaded gasoline” hypothesis.
(Tl;dr: high blood levels of lead, especially in childhood, affect cognition and impulse control, leading to violence. The 1970s push to remove lead from housing and gasoline resulted in a drop in violent crime a generation later.)
The chart on the left is kind of hard to make out, especially the violent crime bars. The chart on the right is much better.
Wish more people knew this. Safety is at an all time high for modern era.
Flies in the face of the copaganda……amazingly the lies get worse when you see your local agency’s closure rates. Police are a grift.
I never knew that North Carolina had so much crime. Why is that?
Are we sure that’s accurate?
Only people I know that have been robbed or assaulted are stories from old people recounting their youth. Those same old people then proceed to tell me and my young friends who have never been assaulted or robbed that crime is worse today.
It would be interesting to include white collar crime in this visualization. I can’t help but wonder if all the blustery claims of rising crime are just a distraction from the actual (white collar) crime.
Looks like North Carolina is the place to stay away from.
Edit: oops! Read it wrong! DC is the place to avoid!
Vandalism really feels like it’s gone up, but everything else down in my lifetime. Obviously feelings rarely coincide with facts though.
Mississippi not being dead last. Also, is DC going off the chart on property crime?
fat old people suck at crime
wait are you telling me that we haven’t been invaded by criminals the last 4 years?!
*Crimes reported by law enforcement agencies
This is in no world reflective of the actual crimes happening, just the ones cops report. I see ten times the crime just driving to work every day that I did 20 years ago, cops just don’t bother to pursue it.
Because things of value and money have shifted a lot more to digital now. I’m guessing the amount of unreported scammers, hackers, grifters and other cybercriminals have increased a hundred fold in recent years. Thieves have just found new ways to steal and harm. And what about white collar crime? How much has that increased? The ones who truly harm way more of us on unimaginable scales that petty thieves and isolated incidents never could? Does anyone keep count of how much banks, tech companies, lobbying etc have covertly stolen from us and made lives significantly worse for society?
This doesn’t tell the whole story.
Didn’t crime go up a record amount in 2020?
What is going on with the placement on the left graphic of states?
this isn’t beautiful at all, it’s impossible to take away much of anything
This is a good time to mention that civil asset forfeiture just at the federal level has been greater than total losses to property crime every since since 2014.
When making a stacked bar chart where one of the variables is much smaller than the other, it’s useful to put the smaller one at the bottom so it’s easier to see how it changes over time.
Putting violent crime at the top of the bar makes it harder to compare year-by-year differences because the differences are smaller than the non-violent crime differences.
I’d love to see a version of this chart with violent crime at the bottom.
It’s hard to see if violent crime goes down.
You don’t have to use the same scale for both
Before really looking at the chart, the colors make the crime look gendered. Because of the the proportion of blue over pink, I initially thought it was crimes committed by men vs women. Obviously got it once I saw the legend, but it took me out of it for a moment.
I bet cameras are a big deterrent and reason for the decline on property crimes
![[OC] Crime rates in the US](https://www.europesays.com/wp-content/uploads/2025/05/dbcpl8wkvy0f1-1920x1024.png)
26 comments
[removed]
How dare this not support the currently pushed narrative!
In 2023, for every 100,000 people in the US, there were 364 violent crimes and 1,917 property crimes. The combined violent and property crime rate fell 3% from 2022, driven by a 3.5% decrease in the violent crime rate and a 2.9% decrease in the property crime rate. Since 2001, that overall crime rate is down 45.2%.
Assault is the most common type of violent crime in the US. In 2023, 72.6% of all violent crimes were aggravated assaults, 18.3% were robberies; 7.5% were rapes, and 1.6% were murders.
Stealing (technically called “larceny-theft” by the FBI) is the most common property crime. In 2023, 70.3% of all property crimes were larceny-thefts, 16.6% were motor vehicle thefts, and 13.1% were burglaries.
At the state level, New Mexico had both the highest violent crime rate (749) and property crime rate (2,887) in 2023. Maine (102) had the lowest violent crime rate and Idaho (809) had the lowest.
Although it’s not a state, the FBI also provides data for Washington, DC, which had a violent crime rate of 1,151 and a property crime rate of 4,307.
If you’re curious about state-level data, we have pages for each state [here](https://usafacts.org/answers/what-is-the-crime-rate-in-the-us/country/united-states/).
The longer time goes on, the more I like the “lead paint/leaded gasoline” hypothesis.
(Tl;dr: high blood levels of lead, especially in childhood, affect cognition and impulse control, leading to violence. The 1970s push to remove lead from housing and gasoline resulted in a drop in violent crime a generation later.)
[Meanwhile most Americans think crime is getting worse.](https://news.gallup.com/poll/652763/smaller-majorities-say-crime-serious-increasing.aspx)
The chart on the left is kind of hard to make out, especially the violent crime bars. The chart on the right is much better.
Wish more people knew this. Safety is at an all time high for modern era.
Flies in the face of the copaganda……amazingly the lies get worse when you see your local agency’s closure rates. Police are a grift.
I never knew that North Carolina had so much crime. Why is that?
Are we sure that’s accurate?
Only people I know that have been robbed or assaulted are stories from old people recounting their youth. Those same old people then proceed to tell me and my young friends who have never been assaulted or robbed that crime is worse today.
It would be interesting to include white collar crime in this visualization. I can’t help but wonder if all the blustery claims of rising crime are just a distraction from the actual (white collar) crime.
Looks like North Carolina is the place to stay away from.
Edit: oops! Read it wrong! DC is the place to avoid!
Vandalism really feels like it’s gone up, but everything else down in my lifetime. Obviously feelings rarely coincide with facts though.
Mississippi not being dead last. Also, is DC going off the chart on property crime?
fat old people suck at crime
wait are you telling me that we haven’t been invaded by criminals the last 4 years?!
*Crimes reported by law enforcement agencies
This is in no world reflective of the actual crimes happening, just the ones cops report. I see ten times the crime just driving to work every day that I did 20 years ago, cops just don’t bother to pursue it.
Because things of value and money have shifted a lot more to digital now. I’m guessing the amount of unreported scammers, hackers, grifters and other cybercriminals have increased a hundred fold in recent years. Thieves have just found new ways to steal and harm. And what about white collar crime? How much has that increased? The ones who truly harm way more of us on unimaginable scales that petty thieves and isolated incidents never could? Does anyone keep count of how much banks, tech companies, lobbying etc have covertly stolen from us and made lives significantly worse for society?
This doesn’t tell the whole story.
Didn’t crime go up a record amount in 2020?
What is going on with the placement on the left graphic of states?
this isn’t beautiful at all, it’s impossible to take away much of anything
This is a good time to mention that civil asset forfeiture just at the federal level has been greater than total losses to property crime every since since 2014.
When making a stacked bar chart where one of the variables is much smaller than the other, it’s useful to put the smaller one at the bottom so it’s easier to see how it changes over time.
Putting violent crime at the top of the bar makes it harder to compare year-by-year differences because the differences are smaller than the non-violent crime differences.
I’d love to see a version of this chart with violent crime at the bottom.
It’s hard to see if violent crime goes down.
You don’t have to use the same scale for both
Before really looking at the chart, the colors make the crime look gendered. Because of the the proportion of blue over pink, I initially thought it was crimes committed by men vs women. Obviously got it once I saw the legend, but it took me out of it for a moment.
I bet cameras are a big deterrent and reason for the decline on property crimes
Comments are closed.