We performed both univariate and bivariate global spatial autocorrelation analyses to explore the spatial distribution characteristics and associations between CVD and various built environment factors. The results presented in Table 4 show that, in the univariate global spatial autocorrelation tests, all variables—including parks and squares, shopping and consumption, transportation facilities, life services, sports and leisure, medical care, catering and food, road network, and CVD—passed the statistical significance test (p z > 2.58), confirming the robustness of the Moran’s I results. All Moran’s I values were positive, clearly revealing significant spatial clustering in the distribution of parks and squares, shopping and consumption, transportation facilities, life services, sports and leisure, medical care, catering and food, road network, and CVD. Specifically, parks and squares had a Moran’s I value of 0.236, reflecting relatively weaker spatial clustering among the variables; whereas shopping and consumption (0.398), transportation facilities (0.386), life services (0.413), and catering and food (0.413) showed stronger spatial clustering patterns, indicating relatively higher spatial autocorrelation.
In the bivariate global spatial autocorrelation analysis, the relationships between shopping and consumption (z = − 1.454, p = 0.070, Moran’s I = − 0.019) and CVD, as well as between road network (z = − 1.076, p = 0.141, Moran’s I = − 0.014) and CVD, also failed to meet the significance criteria (p z > 2.58), suggesting that these bivariate relationships were not statistically significant and were therefore excluded from subsequent analyses. Among the remaining bivariate combinations with CVD, transportation facilities and CVD (z = 17.714, p z = 11.101, p z = 12.035, p z = 17.918, p z = 9.719, p z-values exceeding 2.58 and p-values below 0.001, with positive Moran’s I values, indicating significant positive spatial correlations between these built environment features and CVD, suggesting that they follow similar spatial distribution patterns. Conversely, parks and squares and CVD (z = − 2.961, p = 0.002, Moran’s I = − 0.039) showed a negative z-score and a negative Moran’s I value, indicating a negative spatial association between parks and squares and CVD, suggesting an opposite spatial trend in their distribution patterns.
The emerging Spatiotemporal hotspot analysis
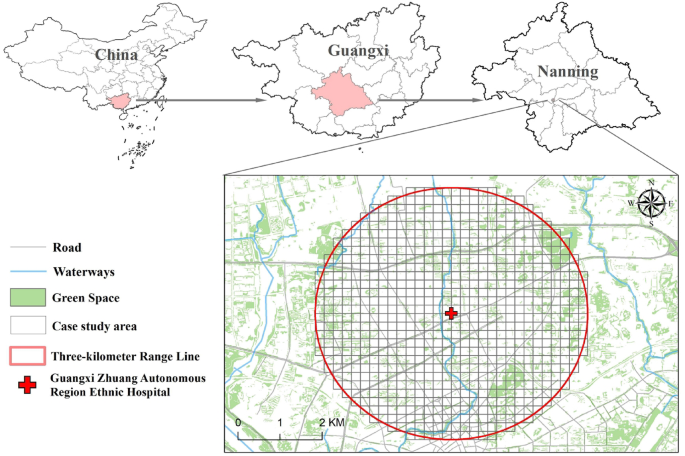
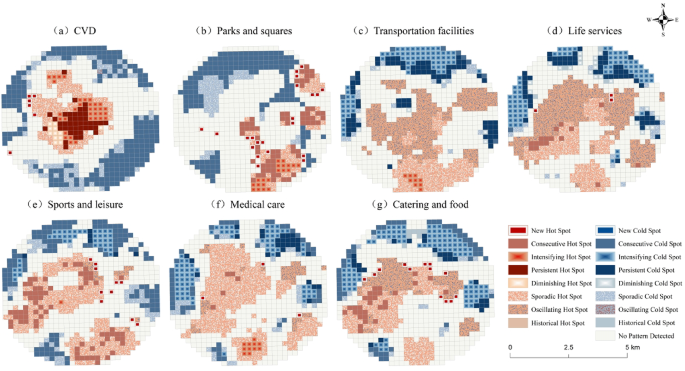
Based on the point distribution data of CVD cases and built environment elements from 2012 to 2022, a 200 m × 200 m space-time cube was constructed to conduct spatiotemporal hotspot analysis (Fig. 2). CVD hotspots were concentrated in the central and northwestern parts of the study area, with persistent and intensifying hotspots in the central area, scattered hotspots along the periphery, emerging hotspots in the west-central region, and cold spots concentrated in marginal areas. These findings imply that the central and northwestern parts of the study area may harbor potential factors contributing to CVD, such as elevated environmental stress due to high population density or psychological tension induced by a fast-paced lifestyle. The persistence of the central region as a hotspot suggests the presence of stable and enduring influencing factors, while the newly emerged hotspot in the west-central region may be associated with recent urbanization, lifestyle transitions, or environmental changes.
Spatio-temporal Hotspot Distribution.
Regarding built environment elements, parks and squares exhibited hotspots in the southeast and northeast, and cold spots in the north, northwest, and southwest. These hotspots may reflect inclusion in designated urban ecological zones, resulting in a higher concentration of such facilities, supporting outdoor activities and promoting both physical and mental health. In contrast, the cold spot regions in the north, northwest, and southwest likely reflect insufficient investment in recreational infrastructure during urban development. Transportation facilities hotspots were found in the central and southern regions, with cold spots in the north and west. The central and southern areas, characterized by dense populations and high commercial activity, have strong demand for transport infrastructure, which drives ongoing development, whereas the north and west may be less developed, resulting in lower transportation demand. Life service hotspots were distributed across the central, southern, southwestern, and southeastern regions, while cold spots appeared in the north and west. This reflects relatively high population density in these areas, with strong resident demand for services such as housekeeping, maintenance, and retail, which has attracted a concentration of related service facilities. Conversely, the cold spots in the north and west suggest that these areas have relatively low population densities and limited demand, making it difficult to sustain large numbers of service facilities. Sports and leisure hotspots were observed in the central, southeastern, and southwestern areas, while cold spots were present in the north, east, and west. This implies that more sports venues and fitness facilities are likely available in the central, southeastern, and southwestern regions, with higher levels of participation in physical activity among residents; whereas the north, east, and west may suffer from facility scarcity or low population density, leading to a less active recreational environment. Medical care hotspots appeared in the central, southern, southeastern, and southwestern regions, with cold spots in the north, east, and west. This indicates that the central, southern, southeastern, and southwestern regions are well equipped with medical resources, allowing better access to medical care for residents; whereas the northern, eastern, and western areas are relatively underserved. Catering and food hotspots were observed in the central, southern, and southwestern regions, while cold spots occurred in the north, east, and west. This indicates high consumer activity in the central, southern, and southwestern regions, where diverse dining demands among residents have fostered a thriving food service industry; whereas food markets in the north, east, and west remain relatively underdeveloped.
Overall, hotspots of various built environment elements tend to converge in the central part of the study area, where hotspots of CVD and life services, among others, are concentrated, suggesting strong urban vitality in this region. In contrast, cold spots are primarily located in the northern area, where resources such as parks and squares, and medical care are notably lacking, reflecting lagging development and inadequate infrastructure in the north.
Spatiotemporal geographically weighted regression
In examining the impact of the built environment on CVD, we first performed a collinearity diagnostic using IBM SPSS Statistics 24.0 to ensure the robustness of the results. The variance inflation factor (VIF) test confirmed that all variables had VIF values below 10, indicating that the dataset did not exhibit significant multicollinearity (Table 5). We then implemented three regression models—OLS, GWR, and GTWR—using IBM SPSS Statistics 24.0 and ArcGIS 10.8 to compare their performance (Table 6). The results showed that the OLS model had an R-squared of just 0.028 and an adjusted R-squared of 0.027, with a relatively high AICc value of 47064.124, indicating that it performed poorly in capturing the relationships among variables. In contrast, the GWR model showed improved R-squared and adjusted R-squared values of 0.222 and 0.221, respectively, with the AICc decreasing to 45619.300, demonstrating a better model fit. The GTWR model further increased the R-squared and adjusted R-squared to 0.240 and 0.239, respectively, and achieved an even lower AICc value of 45558.500, outperforming the GWR model. These findings provide strong evidence of the GTWR model’s superiority in capturing the complex relationships between the built environment and CVD, as it accounts for variation across both spatial and temporal dimensions, thereby offering a more accurate representation of their dynamic associations.
Table 7 reports coefficient statistics from GTWR model, highlighting the spatially dynamic patterns of how various environmental factors influence cardiovascular health. Notably, parks and squares, along with medical care, exhibited the most pronounced extremes in their effects, while life services demonstrated the most stable influence, albeit with limited marginal benefits, and other factors exhibited diverse spatially varying associations.
The data revealed that parks and squares (mean = − 0.018) exhibited a marked polarization in their impact, with coefficient values ranging from − 3.79 to 9.438 (standard deviation = 1.504), suggesting strong spatial heterogeneity in the health effects of green space—where high-quality parks may considerably reduce disease risk, whereas poorly designed or inaccessible green spaces may lead to adverse impacts. Medical care had a coefficient range of 2.0 (–0.383 to 1.619), where the positive extreme (1.619) reveals health disparities in areas with limited access to medical services, and the negative extreme (–0.383) underscores the protective effect of high-quality medical facilities. In contrast, life services exhibited the smallest coefficient variation (–0.246 to 0.225, SD = 0.061), reflecting their role as universally accessible basic services; though their low mean (0.028) and median (0.017) values suggest limited marginal effects. Sports and leisure demonstrated asymmetric polarization (range = − 0.855 to 1.11), indicating a threshold effect, where intensifying facility coverage may be necessary to trigger significant health benefits. Transportation facilities exhibited a strong positive effect overall (with 75% of regions showing coefficients > 0.28), although the minimum value (–0.215) indicates elevated risk in extremely underserved areas. For catering and food, 90% of coefficient values were below 0.1 (range = − 0.27 to 0.074), and the left-skewed distribution supports the notion of chronic cumulative risk in areas densely packed with fast food outlets.
In the GTWR analysis results, all grid-level p-values across the study area were below 0.05, successfully passing the threshold for statistical significance and confirming the robustness of the model outputs. We then visualized the GTWR coefficients using ArcGIS, classifying them into seven intervals. To compare the spatiotemporal effects of different built environment features on CVD, we partitioned the data from 2013 to 2022 into five discrete time intervals. For each period, we calculated the average coefficients and conducted comparative analyses, as illustrated in the results.
As shown in Fig. 3, in terms of parks and squares, over 70% of spatial grid cells exhibited negative regression coefficients, indicating a predominantly suppressive effect, albeit with strong variation and notable spatial heterogeneity. The central hotspot region displayed significant positive effects, likely influenced by usage behaviors and social context, whereas smaller zones in the northwest were dominated by negative effects, potentially linked to local environmental characteristics. Temporally, from 2013 to 2018, the number of maximum-value grids in the central region increased, suggesting growing positive effects, possibly resulting from changes in surrounding environment or utilization patterns; from 2018 to 2022, these peak values declined and overall coefficients approached neutrality, reflecting a weakening and stabilization of impact intensity, likely attributable to improved urban planning and heightened public health awareness.
Regarding transportation facilities, more than 90% of spatial grid coefficients were positive, suggesting that transport infrastructure tends to promote CVD incidence in most areas. The central and northern hotspot zones exhibited strong positive impacts, likely attributable to high traffic volumes and severe pollution; whereas some intermediate areas between them showed negative effects, possibly reflecting well-planned traffic systems. Between 2013 and 2022, the variation in regression coefficients gradually decreased, with a reduction in peak grid counts in the central and northern regions, suggesting weakening transportation-related impacts; while increasing positive values in the southwest hinted at the formation of a new hotspot cluster, likely driven by accelerated economic activity and escalating traffic congestion in the region.
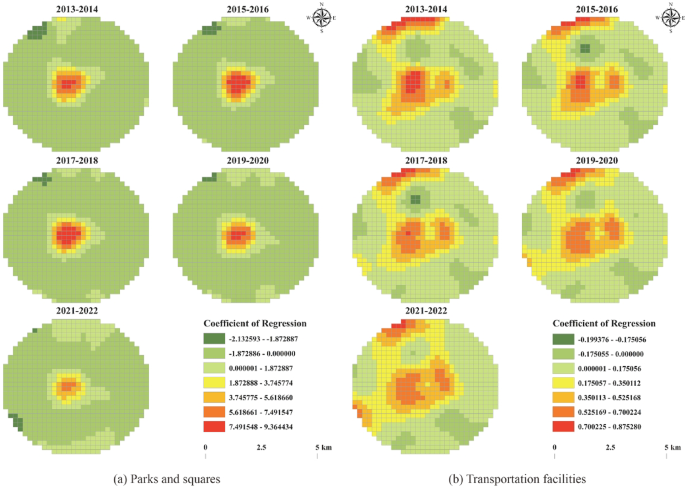
Regression coefficient distribution of parks and squares and transportationfacilities.
As shown in Fig. 4, regarding life services, over 60% of the spatial grid cells exhibited positive regression coefficients, with central and northern regions displaying strong positive associations due to high facility density and fast-paced urban lifestyles, indicating significant positive correlations with CVD. Temporally, the distribution of coefficients evolved from a U-shaped pattern (2013–2014) to an H-shaped pattern by 2021–2022, reflecting transformations in urban development and lifestyle behaviors. In the northwest, the number of negative extreme-value grids declined, indicating a weakening of the protective effect; while the southwest emerged as a center of negative values, potentially due to the integration of health-promoting design in emerging facilities. Overall, the influence tended toward neutral (zero) values, likely due to optimized urban planning and rising health consciousness among residents.
For sports and leisure facilities, positive and negative coefficients were almost evenly distributed, indicating strong spatial divergence, with prominent positive extremes in the northeast and northwest. Over time, positive-effect areas in the northwest initially expanded due to urban development, then contracted as health awareness rose and facility optimization occurred. In the northeast, the area of positive coefficients shifted westward and diminished, influenced by shifting population density and infrastructure development. In the central region, the number of negative grids decreased, likely due to the occupation of recreational spaces; and in the southwest, some grid cells exhibited increasing positive values, potentially linked to facility construction or use-related issues. Overall, the effects trended toward neutrality, likely due to recent improvements in the planning and management of public recreational infrastructure.
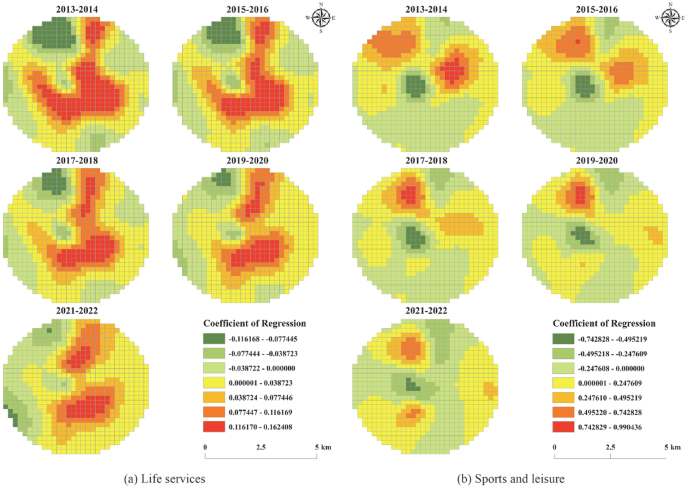
Regression coefficient distribution between life services and sports and leisure.
As shown in Fig. 5, in the context of medical care, more than 60% of spatial grid cells exhibited positive regression coefficients, with the northern region showing significant positive associations, likely due to intensive patient mobility. In contrast, small zones between the central and eastern regions showed negative effects, likely owing to a robust primary healthcare network. Temporally, from 2013 to 2022, the variability in regression coefficients decreased. Positive extreme-value grids in the north declined, attributed to optimized spatial allocation of healthcare resources, while a downgrading of large positive-value zones in the south highlighted improvements in healthcare infrastructure. Negative-value clusters were primarily concentrated in the central and eastern regions. In the central region, land-use reallocation weakened service capacity and reduced negative-value grids; in the eastern area, they first declined with service restructuring and then increased after subsequent improvements. Overall, the spatial trend shifted toward negative effects, driven by increased investment, layout optimization, enhanced primary care services, and improved disease prevention efforts.
For catering and food facilities, over 60% of spatial grids exhibited negative coefficients, with a predominance of healthy dining in the north that was associated with reduced CVD risk. In contrast, the southeast, northeast, southwest, and northwest all exhibited positive associations with CVD. Between 2013 and 2022, positive extreme values gradually increased in the four peripheral regions, while the magnitude of negative values in the north diminished. Overall, the spatial trend shifted toward more positive associations, attributed to rapid urban expansion, changing dietary behaviors, and the growing restaurant industry, with fast food culture and the rise of food delivery significantly reshaping residents’ dietary patterns, which may adversely impact cardiovascular health.
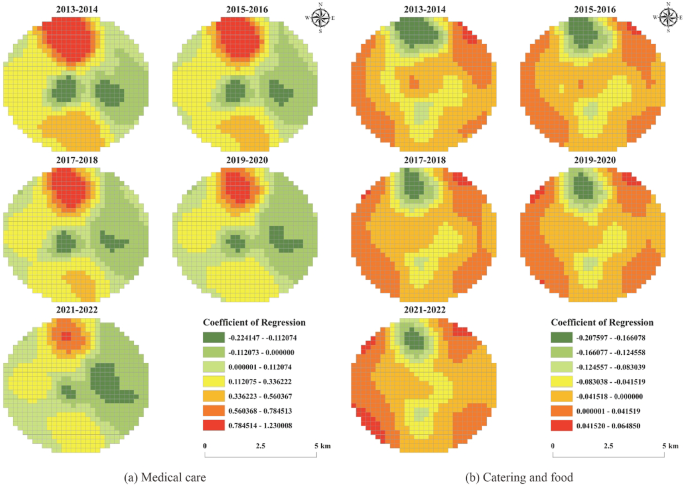
Regression coefficient distribution of medical care and catering and food.