![[OC] - Job density map for US public and private companies](https://www.europesays.com/wp-content/uploads/2025/05/uy4upyqwnh1f1-1920x1024.png)
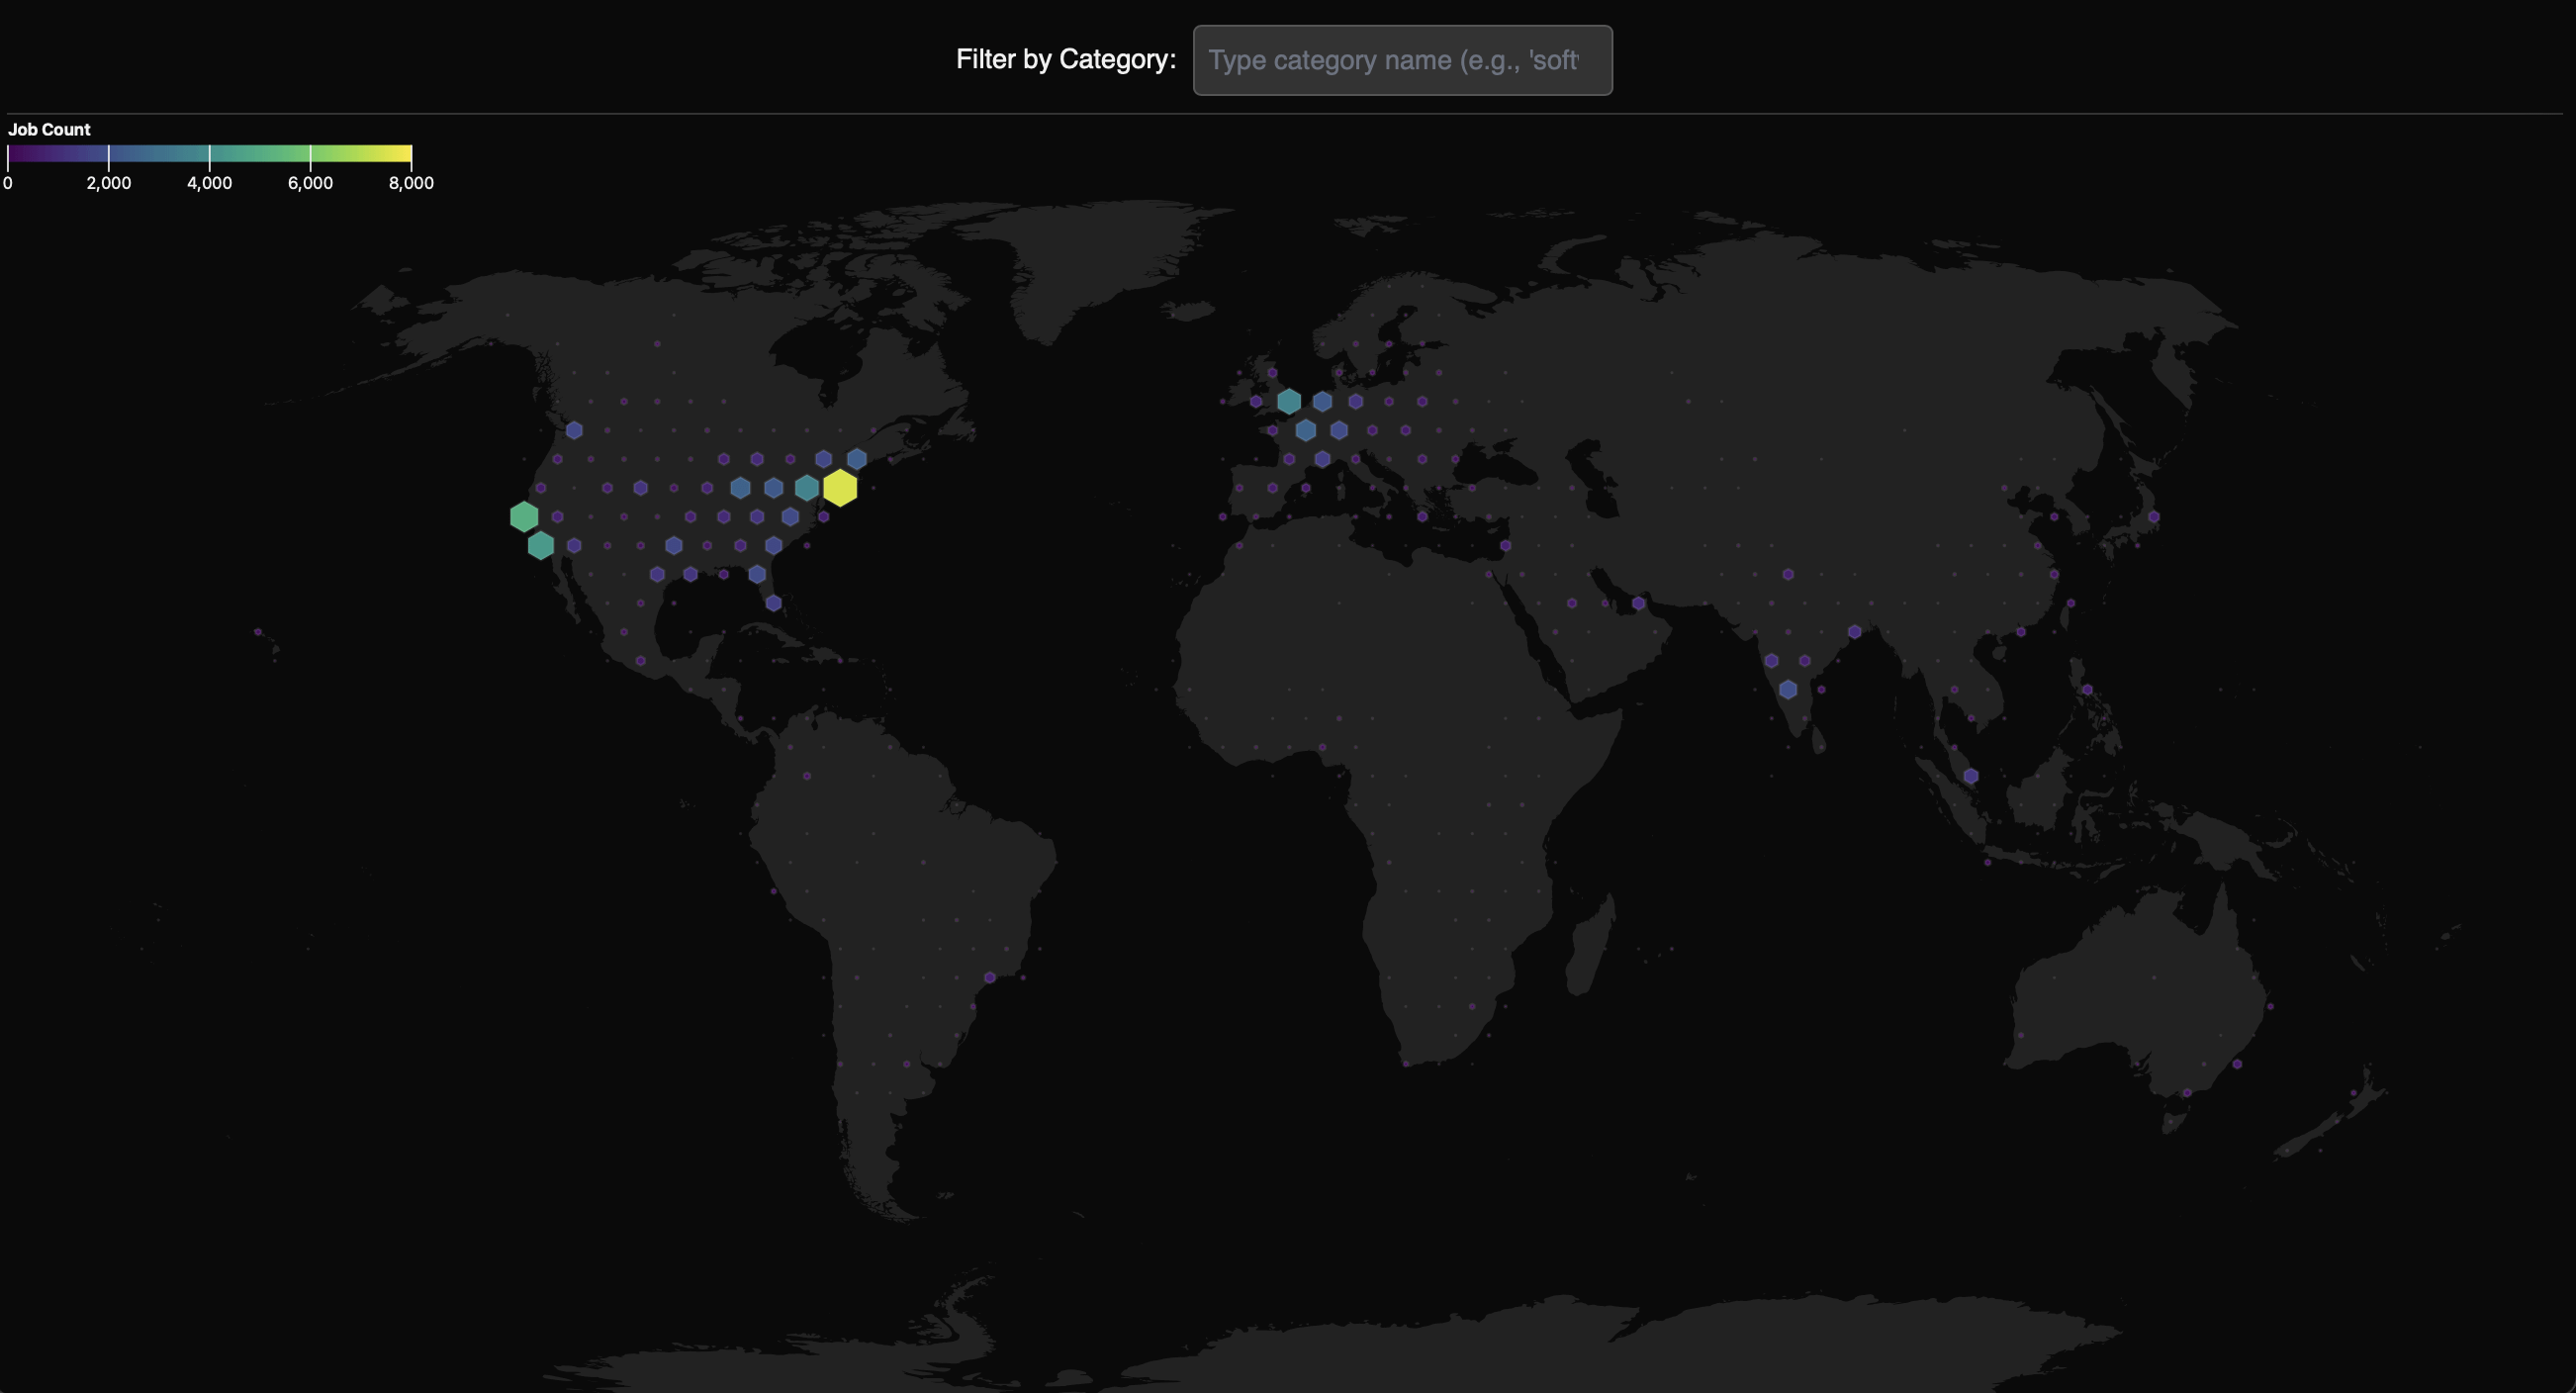
Explore at https://jobswithgpt.com/blog/jobs-density-visualization/ Technical details:
- 100K jobs sample of various US companies public and private of all sizes.
- Automatic categorization using k-means into about 300 categories – embeddings computed over keywords extracted from job-postings using GPT. We pick up a category name by inspecting few samples in the automatic categorization. Todo: some categories are too-close to each other and can be merged.
- D3 visualization using observable plot. Todo: adding a way to select – brush a region.
- I find it interesting to see the "lights" switch from SF to NY region when I search for software vs finance etc.
- Hope it provides some new insights. Any feedback welcome!
Posted by jobswithgptcom
2 comments
Source: Public job listing data
Tools: GPT models, text and embedding + d3.
Looks cool, but TBH its not great seeing markers in the middle of the ocean when there aren’t any islands with substantial populations there.
Comments are closed.