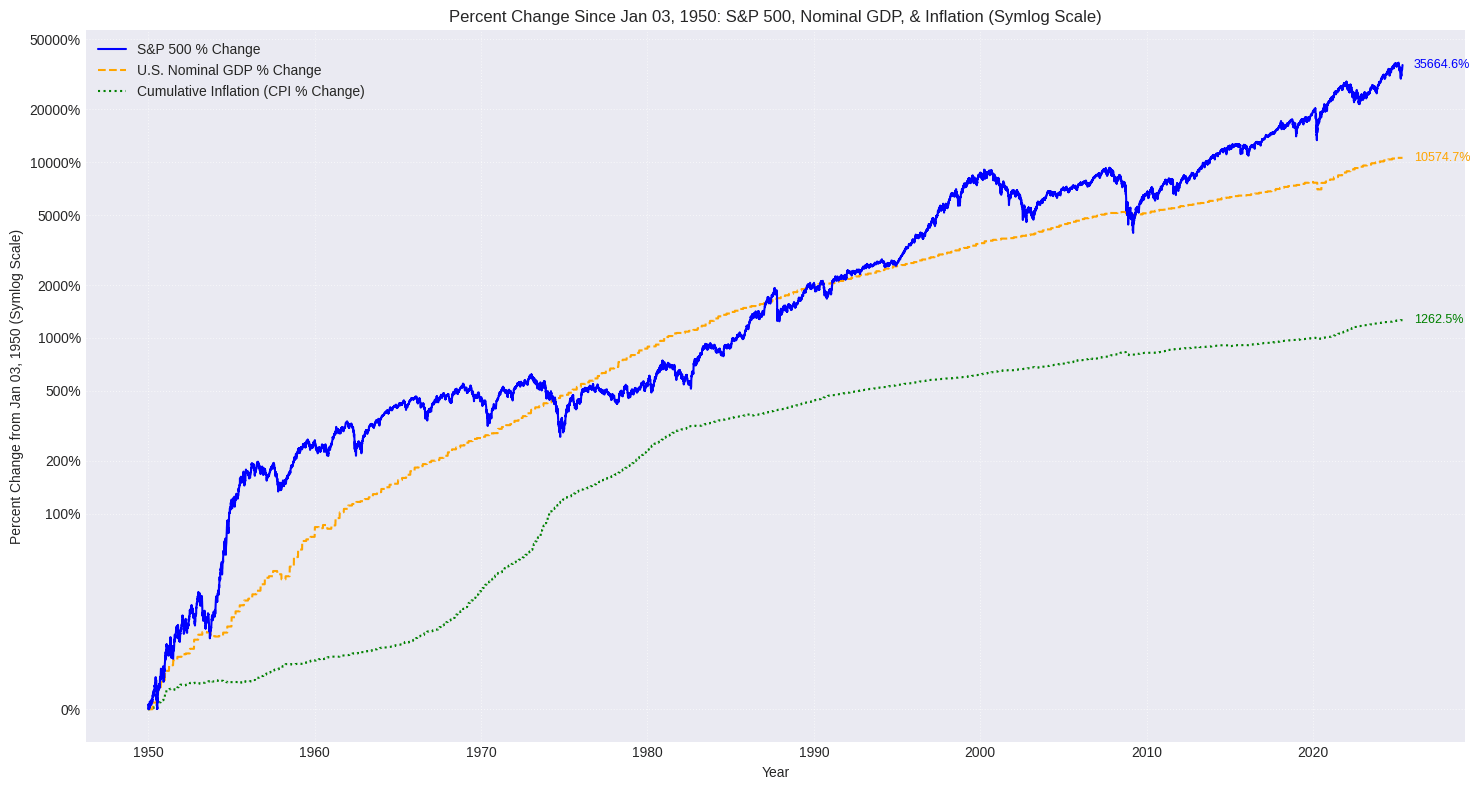
[OC] Percent Change Since Jan 03, 1950: S&P 500, Nominal GDP, & Inflation (Symlog Scale) Posted by Synfinium Tags:DataData Is BeautifulDataIsBeautiful 4 comments Add federal minimum wage and median household income. source : [https://fred.stlouisfed.org/data/GDP](https://fred.stlouisfed.org/data/GDP) ,[https://fred.stlouisfed.org/series/CPIAUCNSpython](https://fred.stlouisfed.org/series/CPIAUCNSpython) matplotlib and yfinance for snp500 prices, Buy signal when below yellow line. The stock market is far more correlated to the actual monetary supply rather than government inflation data Comments are closed.
source : [https://fred.stlouisfed.org/data/GDP](https://fred.stlouisfed.org/data/GDP) ,[https://fred.stlouisfed.org/series/CPIAUCNSpython](https://fred.stlouisfed.org/series/CPIAUCNSpython) matplotlib and yfinance for snp500 prices,
The stock market is far more correlated to the actual monetary supply rather than government inflation data
4 comments
Add federal minimum wage and median household income.
source : [https://fred.stlouisfed.org/data/GDP](https://fred.stlouisfed.org/data/GDP) ,[https://fred.stlouisfed.org/series/CPIAUCNSpython](https://fred.stlouisfed.org/series/CPIAUCNSpython) matplotlib and yfinance for snp500 prices,
Buy signal when below yellow line.
The stock market is far more correlated to the actual monetary supply rather than government inflation data
Comments are closed.