This section contains details regarding the procedures employed in acquiring and processing the physiological and ambient environment data collected within our extreme environments chamber. The experiment design, sensor based data acquisition and subsequent computational processing steps are described to ensure the transparency and repeatability of our research. We will provide details on participant demographics, the experimental scenarios employed, the equipment and facilities utilized for data collection, and the data processing methodologies, including data synchronization, concatenation, and cleaning.
The study involved human participants and was therefore reviewed and approved, with application number 18213, by University of the West of Scotland Computing Engineering and Physical Sciences Ethics Committee. All participants were given an information sheet and a consent form outlining the study’s goals, methods, data collection process, and commitment to participant privacy and secure data storage. All participants provided written informed consent for their involvement in the study and the subsequent publication of anonymized data derived from this research.
Participants
The study included a cohort of 14 participants, selected to represent diverse demographic characteristics within the constraints of its privacy-preserving design. As shown in Fig. 1, participants spanned multiple age groups and both male and female participants were included. The lack of participants outside the presented age groups and an unbalanced gender representation arose unintentionally due to recruitment biases toward accessible populations. While these demographic gaps may limit analyses of individual differences linked to age or sex, the dataset provides a standardized framework for investigating environmental interactions under controlled yet ecologically valid conditions. Additionally, the cohort comprised individuals from distinct ethnic backgrounds. It is pertinent to note that while these demographic details are pivotal for contextualizing the diversity within our participant pool, it is emphasized that such identifying metadata has not been recorded in the dataset22, safeguarding participant anonymity and adhering to ethical research practices.
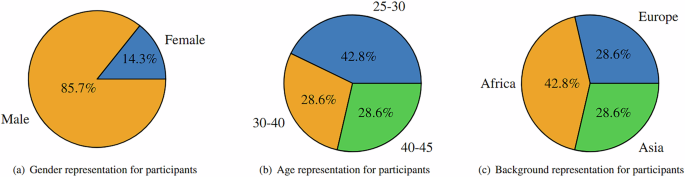
Participant cohort demographic variance.
Scenarios
Participants were seated at a workstation in the centre of the extreme environments room and were instructed to limit their speech and movements for the duration of the recording, in order to avoid artefacts that would undermine the correlation between ambient environment signals and physiological health indicators. The workstation featured a single board computer connected to an array of sensors for humidity, temperature, pressure, air quality, light, and skin resistance measurements, a mobile device with an application for sound level recording, an embedded board for ECG acquisition, a speaker for noise level adjustment, a laptop and peripheral devices for the single board computer.
Sixteen measurement scenarios were designed, as detailed in Table 2, based on 4 controlled variables. These scenarios represent all unique combinations of values for the chosen controlled variables, calculated using the rule of product. This full factorial design (24 = 16 scenarios) ensures systematic testing of all possible interactions between environmental factors, critical for hypothesis generation and avoiding oversight of potentially relevant correlations. While a fractional factorial design could have improved efficiency, it would sacrifice higher-order interactions–a trade-off incompatible with our exploratory focus on ambient environmental effects. The controlled variables selected were temperature, humidity, light and sound. We did not exert any control on pressure and air quality since the extreme environments chamber was not equipped with the technology necessary, however variations in these signals appeared naturally as a consequence of temperature and humidity adjustments.
Each scenario lasted for approximately 3 minutes summing to a total 48 minutes of active participation in the experiment required from each participant, excluding the time needed to adjust the environmental conditions within the extreme environments chamber. The time taken to adjust temperature and humidity from one scenario to another was between 15 and 25 minutes depending on the direction of the adjustment, increment or decrement. These gradual transitions replicate real-world environmental dynamics and the response of ventilation systems. In contrast, noise and light were adjusted instantly using a speaker and artificial lighting, simulating abrupt natural changes such as entering a brightly lit room or encountering sudden loud noise.
The sequence of scenario execution was determined by the duration required to stabilize the controlled variables. Given the relatively prolonged adjustment periods for humidity and temperature, we devised four subsets of measurements. Each subset maintained consistent temperature and humidity levels while introducing variations in sound and light parameters. Consequently, participants were tasked with adhering to the experimental protocols continuously for a duration of 12 minutes, constituting one subset of scenarios. Subsequently, they were allotted a relaxation period lasting between 15 to 25 minutes to facilitate adjustments in temperature or humidity levels.
The specific values for the controlled variables were determined following recognized standards and guidelines. For instance, temperature values adhered to the moderate and high recommendations from ISO 7730 standard as identified by26, while humidity range aligned with values used in previous studies with comparable temperatures27. Noise levels were set in accordance with both UK regulations for workplace noise control28 and World Health Organization guidance29. Light intensity values were determined during measurements, reflecting ambient lighting conditions in the absence and presence of artificial lighting.
While some residual coupling effects between consecutive scenarios may occur due to the ordering, explicitly documenting the sequence and stabilization intervals allows potential users to consider these dependencies in their analyses, ensuring a robust interpretation that aligns with the study’s real-world-inspired constraints. Our study design aimed to mitigate variability in physiological responses through controlled environmental conditions and a consistent experimental protocol for all participants. This approach helps standardize the context in which physiological signals were recorded and ensures comparability across participants. However, no dedicated effort test or baseline measurement was performed prior to data collection. Depending on the intended application, researchers could perform baseline corrections, normalization techniques, or other post-processing methods to address individual differences. While the controlled conditions and standardized protocol ensure a high degree of consistency in the recorded signals, future studies could benefit from incorporating baseline measurements to further extend the dataset’s applicability.
Equipment and Facility
The experimental apparatus employed for data collection includes a state-of-the-art extreme environments chamber designed for the precise manipulation of environmental conditions. This chamber facilitates rigorous experimentation by allowing controlled adjustments to temperature, humidity, and oxygen levels, thereby creating extreme environmental scenarios for scientific investigation. The utilization of such a chamber in controlled laboratory settings provides a controlled platform for investigating the nuanced interactions and responses of biological or material entities under extreme conditions. The chamber, it’s control panel and our sensor setup within the chamber are shown in Fig. 2. The environmental chamber can tipically maintain a temperature control accuracy of ±1 °C and a humidity control accuracy of ±3%, as specified by the manufacturer, Sporting Edge (UK) Ltd. However, these values represent typical stability intervals rather than absolute limits, meaning minor fluctuations may still occur due to environmental dynamics, sensor placement, and the inherent accuracy limitations of the sensors used for measurement.
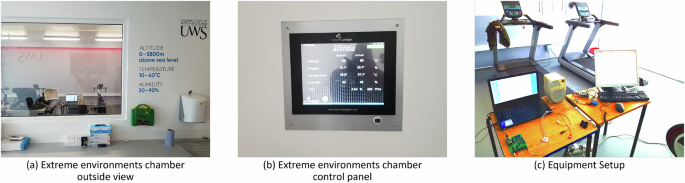
Facilities and equipment used to setup data collection experiments.
This project utilizes various sensors to monitor environmental and physiological data, a visual depiction of each component is presented in Fig. 3. The Bosch BME680 sensor acts as a multi-purpose environmental monitor, measuring temperature (ranging from −40 to +85°C), humidity (0 to 100%), pressure (300 to 1100 hPa), and Indoor Air Quality (IAQ) through detection of volatile organic compounds. The accuracy tolerance of the Bosch BME680 sensor for temperature measurements is \(\pm 0.5\)°C to \(\pm 1.0\)°C, for humidity the tolerance is \(\pm \mathrm{3 \% }\) and \(\pm 0.12\) Pa for pressure measurements. The PLANTOWER PMS5003 sensor focuses on airborne particles, providing counts for various sizes particles (greater than 0.3, 0.5, 1, 2.5, 5, and 10 micrometers) within a 0.1-liter air sample. This allows it to estimate concentrations of PM1, PM2.5, and PM10 particles reported in micrograms per cubic meter). Light levels are monitored by the VEML7700 sensor, with a detection range spanning from complete darkness (0 lux) to very bright environments (approximately 120,000 lux). The iNVH android application by Bosch handles noise monitoring, utilizing the built-in microphone of a mobile device (typically MEMS) and offering integrated calibration for various mobile device models.
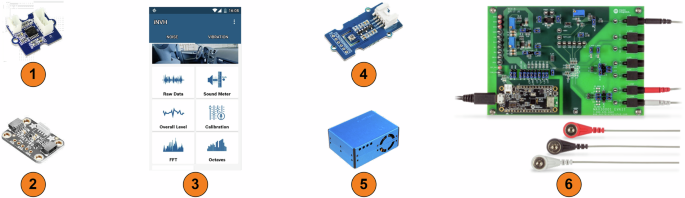
Sensing Devices and Software: (1) Grove GSR Sensor; (2) VEML7700; (3) Bosch iNVH; (4) Bosch BME 680; (5) PLANTOWER PMS5003; (6) Maxim Integrated MAX30001EVSYS.
Moving towards the acquisition of physiological data, the Grove Galvanic Skin Response (GSR) sensor is employed to gauge skin resistance, which serves as an indicator of electrodermal activity, captured by affixing two electrodes onto the index and middle fingers of the left hand. Concurrently, for monitoring cardiac activity, we employed the Maxim Integrated MAX30001 evaluation kit. This kit offers comprehensive data, including raw electrocardiogram (ECG) readings, as well as the calculation of R-R intervals, representing the duration between consecutive heartbeats. The three-lead placement for acquiring cardiac activity data were place on the torso of the participant, following public clinical guidelines30.
A single-board computer, Raspberry Pi 3 Model B+, functions as the central processing unit for numerous sensors. It has a 1.4 GHz 64-bit quad-core processor and 1 GB of DDR2 RAM. It provides various connection options, including USB, Bluetooth, Wi-Fi, and a 40-pin General-Purpose Input/Output interface. Streamlining sensor integration is the GrovePi Plus add-on board, which enables communication capabilities via the Inter-Integrated Circuit (I2C) protocol and facilitates the utilization of analog sensors through the incorporation of an analog-to-digital converter (ADC). The method of connection varies depending on the sensor type: I2C for BME680 and VEML7700, analog for Grove GSR, Serial Peripheral Interface (SPI) for PLANTOWER PMS5003, and Universal Serial Bus (USB) for the Maxim Integrated MAX30001 when interfaced with a Windows 10 laptop.
Data Processing
Since we utilize a Raspberry Pi, a Windows laptop, and a mobile device to integrate sensors, the raw data originates from three distinct sources and it necessitates synchronization based on the timestamp of each sample within the distinct files. Subsequently, all three files are loaded into memory as separate dataframes. We then iterate through each dataframe’s samples to align timestamps and concatenate them feature-wise into a unified dataframe encompassing both predictor and target variables. Outliers were identified and removed on a per-participant basis, based on the Z-score method, which calculates how much a data point deviates from the mean in terms of standard deviations. The mean and standard deviation for each data point were calculated using Eq. 1 and Eq. 2, respectively. Then we subtracted the mean from the value of the data point and divided by the standard deviation to determine the Z-score as described in Eq. (3). We had set a threshold value of +/-3, which considered data points with Z-scores greater than +3 or less than -3 as outliers. Additionally, observations with nan or null values were excluded from the dataset.
$$\mu =\frac{{\sum }_{i=1}^{n}{x}_{i}}{n}$$
(1)
$$\sigma =\sqrt{\frac{{\sum }_{i=1}^{n}{({x}_{i}-\mu )}^{2}}{n-1}}$$
(2)
$$Z=\frac{x-\mu }{\sigma }$$
(3)
The PM sensor collected data on 9 distinct variables including concentration levels for PM1, PM2.5 and PM10, and the count of particles exceeding diameters of 0.3 μm, 0.5 μm, 1 μm, 2.5 μm, 5 μm and 10 μm. However, due to a generally good quality of air at the testing location, concentration levels for PM1, PM2.5 and PM10 and the number of particles with a diameter greater than 2.5 μm, 5 μm and 10 μm were predominantly observed to be zero as shown in Table 3. They were therefore considered redundant and removed from the dataset. However, raw data files are available for independent use or integration. These files can be synchronized and concatenated according to the previously described methods, or they can be employed without following our data processing steps.
It is pertinent to note that the count of samples in the aggregated dataset, following the preprocessing procedures is 33, 993. The discrepancy between the actual number of data points and the expected count, totaling 6, 327 observations, can be ascribed not only to missing values or outliers, but also to the unavailability of several participants for the entire duration required to complete all scenarios. The expected count derived from the participation of 14 individuals, engaging in 16 scenarios each lasting 3 minutes, with a sampling frequency of 1 Hz, would have amounted to 40, 320 data points.