What am I looking at? I get more money back in taxes next year?
“When Tariffs cut in, many people’s Income Taxes will be substantially reduced, maybe even completely eliminated. Focus will be on people making less than $200,000 a year,”
Now add the share of the national debt per capita. Basically all this bill does is stop collecting taxes but ramp up the spending. It’s like saying “we’re not paying our credit card bill any more look how much money we’re saving!”
If you are making a million a year- is 50k extra really worth adding $3.8 trillion to the deficit?
Happy cake day, OP!
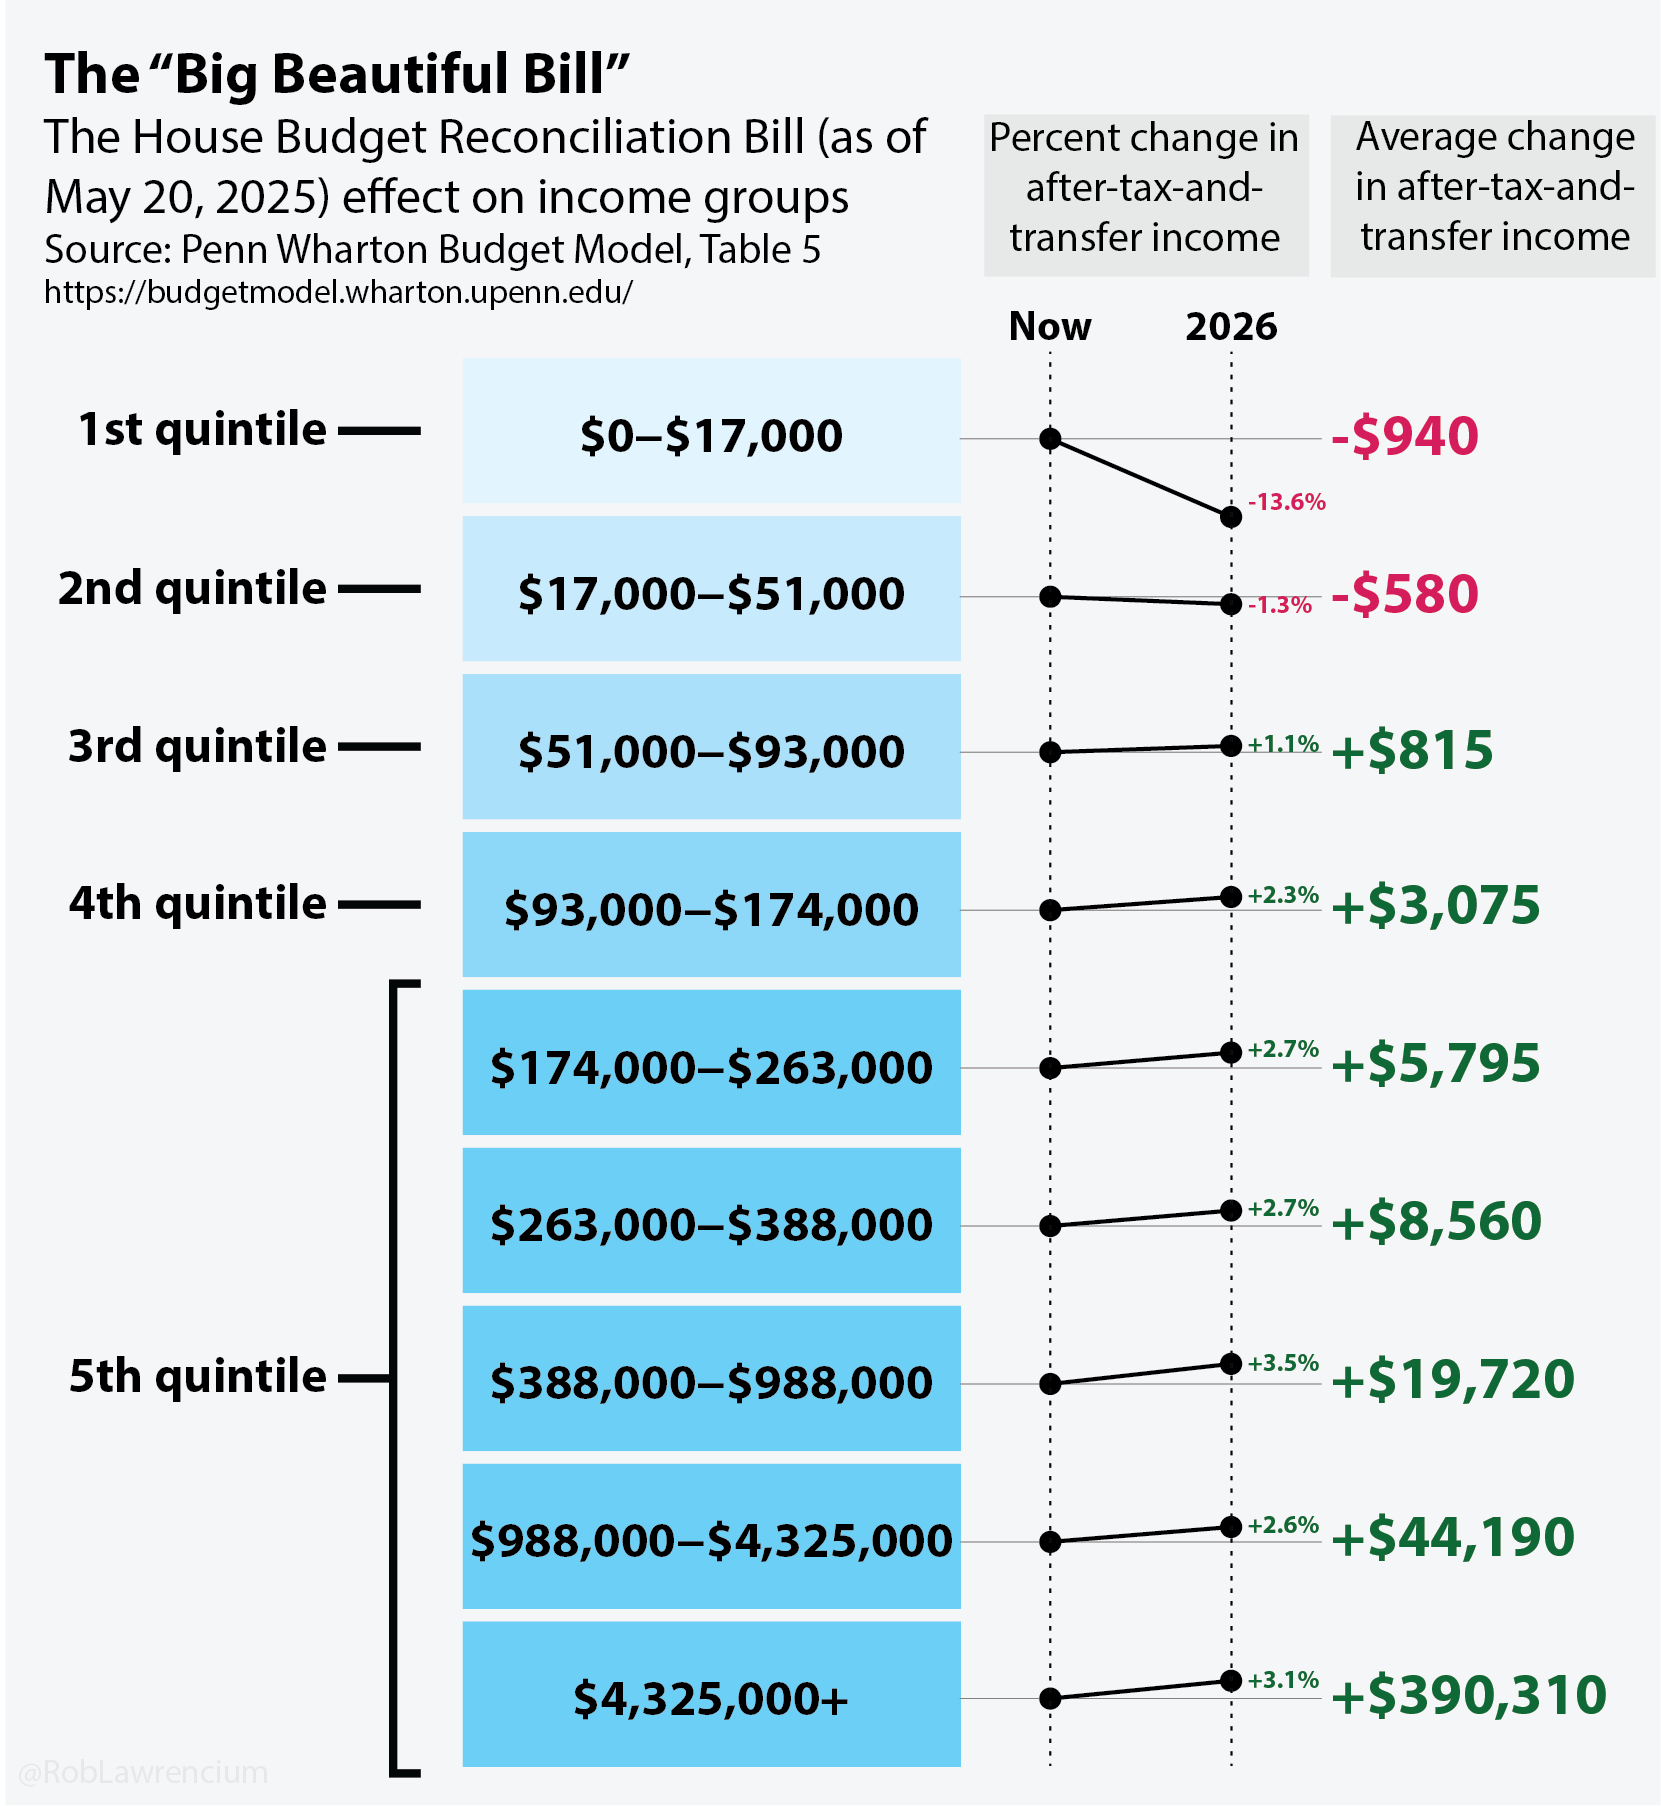
Nice illustration. It took me a second to realize what the Now and 2026 lines were showing because a decline in wealth extends down towards the higher quintiles in the chart. A simple fix would be to reverse the categories, but leave the lines between now and 2026 the same. This way when the line declines, it’s declining towards the lower category, which visually implies a reduction of value.
– Why are higher income brackets on the bottom
– Why are these very different cohort sizes represented with the same size boxes
So as long as we set minimum wage to 51k, everybody wins? Kinda
I’m guessing that for people claiming single on their taxes?
I want to see votes based on which group they are in
It is cool how this represents the will of the people.
Great, I get $815 and all I have to do is accept the end of democracy?! What a steal. /s
make sure to r/votewithyourdollar
I’m getting a massive tax cut and it feels so wrong. What horrible and unsustainable policy, but this is what people voted for! Especially the rural 1st and 2nd quintiles.
They could have increased the standard deduction to $50,000 per person and decrease the deficit.
But they chose to give the wealthy tax cuts instead..
As someone comfortably in the middle of the 5th quintile, I’m fine without an extra $10k. Please give the bottom quintile their money back
Hi. No thank you. I’ll pay my taxes if you do
Thank god those people making under 17k finally have to pay their fair share.
Fuckin a…
Doesnt someone in 4th quartile also have the biggest ability to use the SALT deduction?
I always thought trickle down economics was that wealth trickled down, not debt.
This is super misleading. The lower quintiles are receiving transfer payments. This is dem strategy 101 relative to tax cuts. You can’t cut taxes on people who don’t pay taxes. Our system is one of the most progressive in the world.
I need to confirm that these figures take the entirety of the bill into consideration. Does it include the increased standard deductions? The Enhanced Child Tax credit?
Wait, so people who make less than 50k are paying more taxes??
I don’t believe I will actually be seeing any of the “green” implied in this chart.
As someone who makes $100M a year I really needed this. Things were getting tight.
I think average total income tax bill would be beneficial as well.
I don’t understand it. Is the income of the lower bracket reducing or the taxes?
I can’t put my finger on why, but I feel like this graph was made to convince me to hold a particular viewpoint.
Stupid question:
Is this pre or post taxes in terms of yearly income?
The poor half of Americans will get poorer to let the rich half get richer.
The irony is that the Orange Turd was elected by the bottom half, and they won’t even understand what is happening to them.
MAGA does not know how to read this.
TLDR, how does this bill actually reduce the income of lower income households?
I think this needs the number of people in each quintile, to show just how many are getting screwed
FWIW, the official CBO estimate is actually *worse* for lower earners.
!["Big Beautiful Bill" Effect on Income Groups [OC]](https://www.europesays.com/wp-content/uploads/2025/05/k4nu5hgm3c2f1-1661x1024.png)
37 comments
Created in Illustrator. Data from Penn Wharton Budget Model Table 5, as of May 20: [https://budgetmodel.wharton.upenn.edu/issues/2025/5/20/house-reconciliation-bill-illustrative-calculations-with-permanence-may-20-2025](https://budgetmodel.wharton.upenn.edu/issues/2025/5/20/house-reconciliation-bill-illustrative-calculations-with-permanence-may-20-2025)
What am I looking at? I get more money back in taxes next year?
“When Tariffs cut in, many people’s Income Taxes will be substantially reduced, maybe even completely eliminated. Focus will be on people making less than $200,000 a year,”
Trump Truth Social post [reported ](https://www.foxnews.com/politics/trump-says-income-tax-cuts-perhaps-elimination-coming-due-tariffs)by Fox News
What a complete joke this administration is.
Now add the share of the national debt per capita. Basically all this bill does is stop collecting taxes but ramp up the spending. It’s like saying “we’re not paying our credit card bill any more look how much money we’re saving!”
If you are making a million a year- is 50k extra really worth adding $3.8 trillion to the deficit?
Happy cake day, OP!
Nice illustration. It took me a second to realize what the Now and 2026 lines were showing because a decline in wealth extends down towards the higher quintiles in the chart. A simple fix would be to reverse the categories, but leave the lines between now and 2026 the same. This way when the line declines, it’s declining towards the lower category, which visually implies a reduction of value.
– Why are higher income brackets on the bottom
– Why are these very different cohort sizes represented with the same size boxes
So as long as we set minimum wage to 51k, everybody wins? Kinda
For anyone confused, check out table 6 from OP’s [source](https://budgetmodel.wharton.upenn.edu/issues/2025/5/20/house-reconciliation-bill-illustrative-calculations-with-permanence-may-20-2025). It makes a bit more sense in my opinion. You can get your percentile from this [website](https://dqydj.com/household-income-percentile-calculator/), it seems. If your number for your age and percentile is negative, this bill passing is equivalent to losing that much money right now. If it’s positive the bill passing is equivalent to being given a check worth that much.
I’m guessing that for people claiming single on their taxes?
I want to see votes based on which group they are in
It is cool how this represents the will of the people.
Great, I get $815 and all I have to do is accept the end of democracy?! What a steal. /s
make sure to r/votewithyourdollar
I’m getting a massive tax cut and it feels so wrong. What horrible and unsustainable policy, but this is what people voted for! Especially the rural 1st and 2nd quintiles.
They could have increased the standard deduction to $50,000 per person and decrease the deficit.
But they chose to give the wealthy tax cuts instead..
As someone comfortably in the middle of the 5th quintile, I’m fine without an extra $10k. Please give the bottom quintile their money back
Hi. No thank you. I’ll pay my taxes if you do
Thank god those people making under 17k finally have to pay their fair share.
Fuckin a…
Doesnt someone in 4th quartile also have the biggest ability to use the SALT deduction?
I always thought trickle down economics was that wealth trickled down, not debt.
This is super misleading. The lower quintiles are receiving transfer payments. This is dem strategy 101 relative to tax cuts. You can’t cut taxes on people who don’t pay taxes. Our system is one of the most progressive in the world.
I need to confirm that these figures take the entirety of the bill into consideration. Does it include the increased standard deductions? The Enhanced Child Tax credit?
Wait, so people who make less than 50k are paying more taxes??
I don’t believe I will actually be seeing any of the “green” implied in this chart.
As someone who makes $100M a year I really needed this. Things were getting tight.
I think average total income tax bill would be beneficial as well.
I don’t understand it. Is the income of the lower bracket reducing or the taxes?
I can’t put my finger on why, but I feel like this graph was made to convince me to hold a particular viewpoint.
Stupid question:
Is this pre or post taxes in terms of yearly income?
The poor half of Americans will get poorer to let the rich half get richer.
The irony is that the Orange Turd was elected by the bottom half, and they won’t even understand what is happening to them.
MAGA does not know how to read this.
TLDR, how does this bill actually reduce the income of lower income households?
I think this needs the number of people in each quintile, to show just how many are getting screwed
FWIW, the official CBO estimate is actually *worse* for lower earners.
[https://www.cbo.gov/system/files/2025-05/61422-Reconciliation-Distributional-Analysis.pdf](https://www.cbo.gov/system/files/2025-05/61422-Reconciliation-Distributional-Analysis.pdf)
This is the dumbest thing in the world.
The US national debt grows daily. The only way to address it is to increase taxes across the board and reduce spending without causing a panic.
Rob from the poor and give to the rich.
If you’re a well-meaning person who voted democrat, earning 6-figures and above, take this as your compensation.
If you’re a low-earner who voted republican, elections have consequences, enjoy them.
Comments are closed.