This was my first time trying to use Python and Pandas (or code at all) for data visualization. Any feedback is appreciated. The goal here was to practice coding graphs and data. I think it turned out alright but the graph might be a bit confusing.
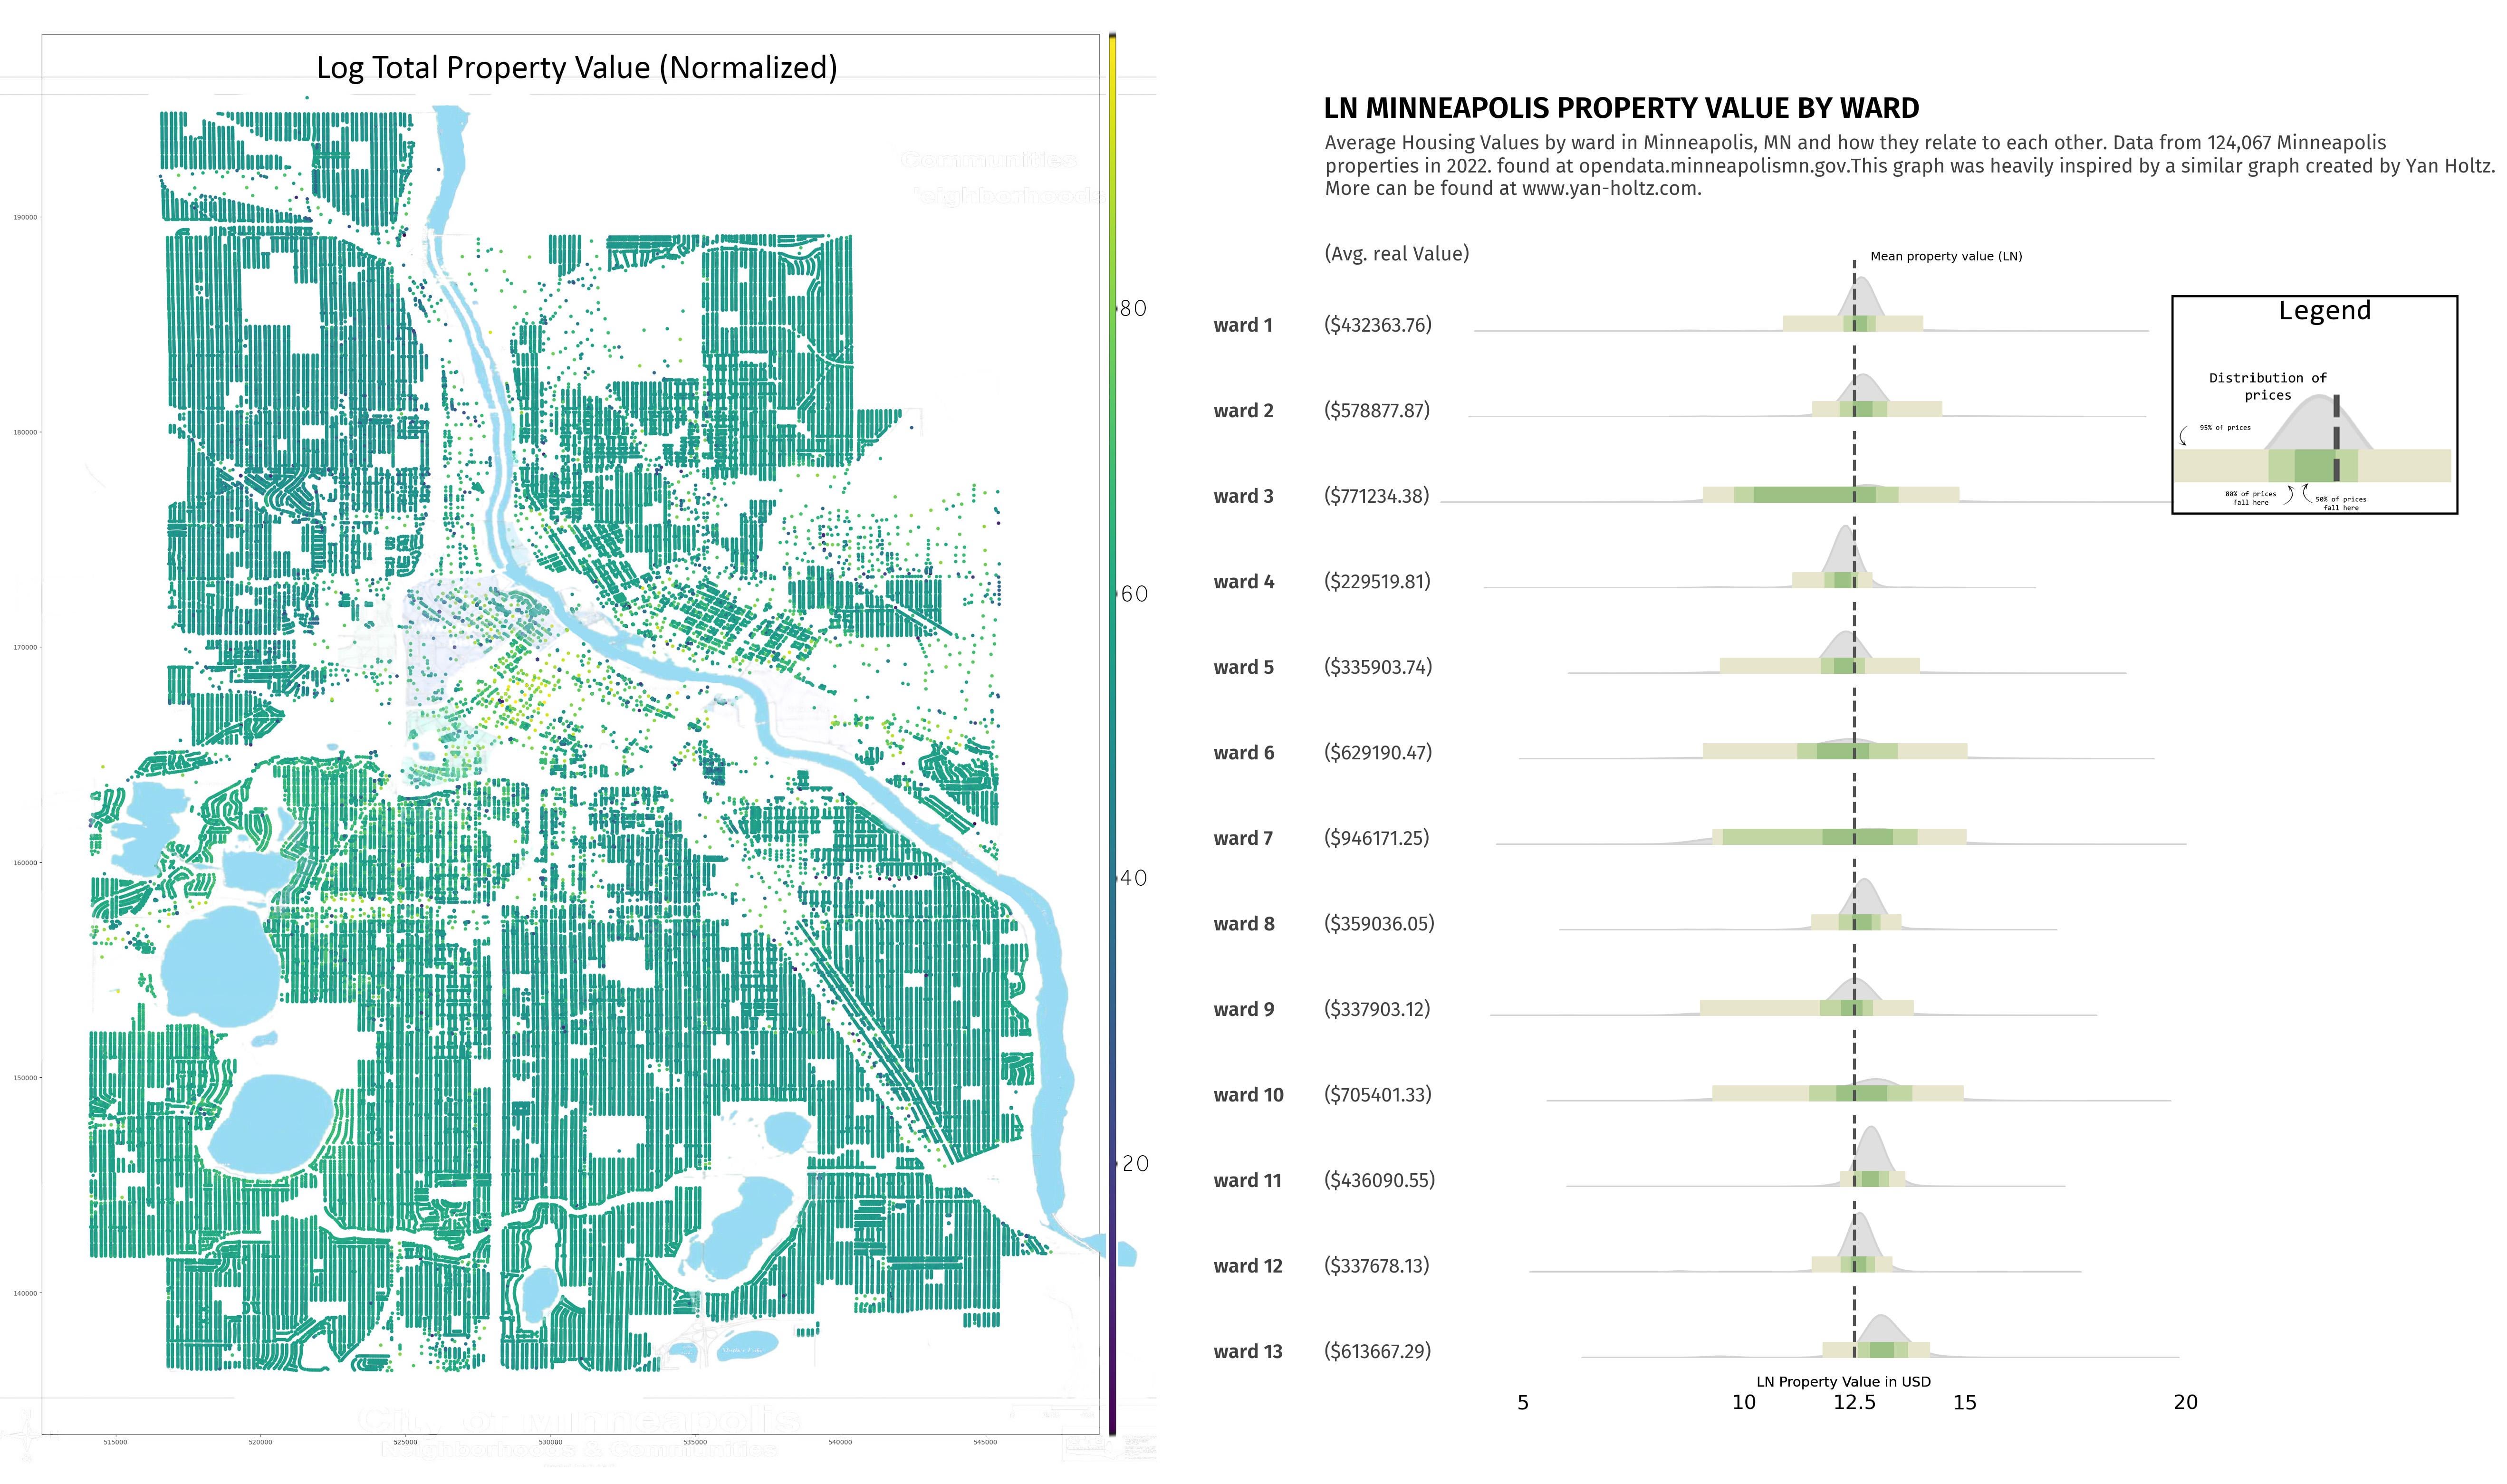
The graph on the left was all me (which is why it’s kinda bad) but the ridgeline plot on the right was heavily inspired by a graph by Yan Holtz ( [https://python-graph-gallery.com/web-ridgeline-by-text/](https://python-graph-gallery.com/web-ridgeline-by-text/) , much more at [https://www.yan-holtz.com/](https://www.yan-holtz.com/) ) who is absolutely incredible and a great resource for learning more about how to make good graphs using Pandas and Seaborn.
I think while not being the most useful thing in the world, it’s at least pretty to look at.
![[OC] Every Minneapolis property graphed by Ln Property Value + Ward Data](https://www.europesays.com/wp-content/uploads/2025/05/1748144713_9lp375mv0e2f1-1920x1024.jpeg)
1 comment
This was my first time trying to use Python and Pandas (or code at all) for data visualization. Any feedback is appreciated. The goal here was to practice coding graphs and data. I think it turned out alright but the graph might be a bit confusing.
Housing data source: [https://opendata.minneapolismn.gov/datasets/assessors-parcel-data-2022](https://opendata.minneapolismn.gov/datasets/assessors-parcel-data-2022) (note that this data is from 2022)
The graph on the left was all me (which is why it’s kinda bad) but the ridgeline plot on the right was heavily inspired by a graph by Yan Holtz ( [https://python-graph-gallery.com/web-ridgeline-by-text/](https://python-graph-gallery.com/web-ridgeline-by-text/) , much more at [https://www.yan-holtz.com/](https://www.yan-holtz.com/) ) who is absolutely incredible and a great resource for learning more about how to make good graphs using Pandas and Seaborn.
I think while not being the most useful thing in the world, it’s at least pretty to look at.
Comments are closed.