No shit. The rentier economy and the ruling class are sucking every penny out of us for everything, and now they get more tax breaks on the backs of disabled and poor people.
I hate it here and I hate our conservative governments actively harming as many people as possible per bill.
Not American but yeah idk if it’ll happen for me. Can barely support myself
Our household views a child as a luxury good and we aren’t planning on trying for a child until we have secured our financial future through aggressive saving at a young age.
This chart takes a lot of effort to understand.
When women have access to education, legal rights, and birth control than time and again most women, like most men, choose to focus on their jobs, personal lives, and education before starting a family. That shouldn’t be surprising.
Women without options tend to have children younger. Which is also why modern women raised in fundementalist and conservative religions, are more likely to have children younger.
I would not have guessed that the highest total birth rate was for women born in 1974. That means there are quite a lot of Zoomers I guess.
1950 cohort is below replacement level?
This chart is a little confusing. But is the tempo effect basically saying women in 1984 had more kids than women in the 1950’s? I always thought the birth rate was declining.
This chart kinda defeats it’s purpose. Can’t understand
In the baby boom era really the best to compare to?
And this is why autism is on the rise. The longer we wait to have children the more likely our child will be born with a problem. Male and females produce less quality gametes as we age and our children pay the price.
Lots of really interesting information here:
-No idea that 1974 was “peak fertility” birth year for women
-Teen pregnancy is WAY down. This is fantastic news, but also seems to correlate strongly to lifetime fertility.
-Millennials are netting out to almost as fertile as boomers. Big surprise to me considering the headlines.
-Damn near linear decrease in fertility from Millennials onward.
Excellent visualization. No pixel is wasted IMO.
So while the Pyramdists panic that the fertility rate is going down, it’s not actually established that women are having fewer children over the full course of their lives, just that they’re not getting knocked up while still is school and while trying to establish their careers.
This graph is very confusing. What is “cumulative fertility”? The baseline is a 1950s woman, but how many kids are we talking about? An 80% decline means what, in real terms? What do the colors signify, proximity to current day? What is the dotted line?
I get that this is summarizing some complicated comparisons, but I’m not sure what this visualization is trying to illuminate.
I was born in 1953 and my Mom was 22. My son’s wife just had their first child and they’re 31.
what the fuck is this graph
Finally a data illustration that’s not just colorful and displays a clear trend but actually has a title, labeled X/Y, labeled data lines, a source, and relevant insights.
Okay, so yes, it takes a while to get what the graph is showing. But once you do, it’s a lot of really interesting info displayed in a very neat way.
It’s cool though, they get to join the soul sucking work force and be empowered.
This data presentation is bad not beautiful
This is actually beautiful
Sorry but this chart is ugly
To quote James Carville
“It’s the economy, stupid”
Can you project this to the population?
Less teen pregnancies LETS FUCKING GOOO
I’m so glad the wife and I bucked this trend. It’s not for everyone but having kids young worked out really well for us.
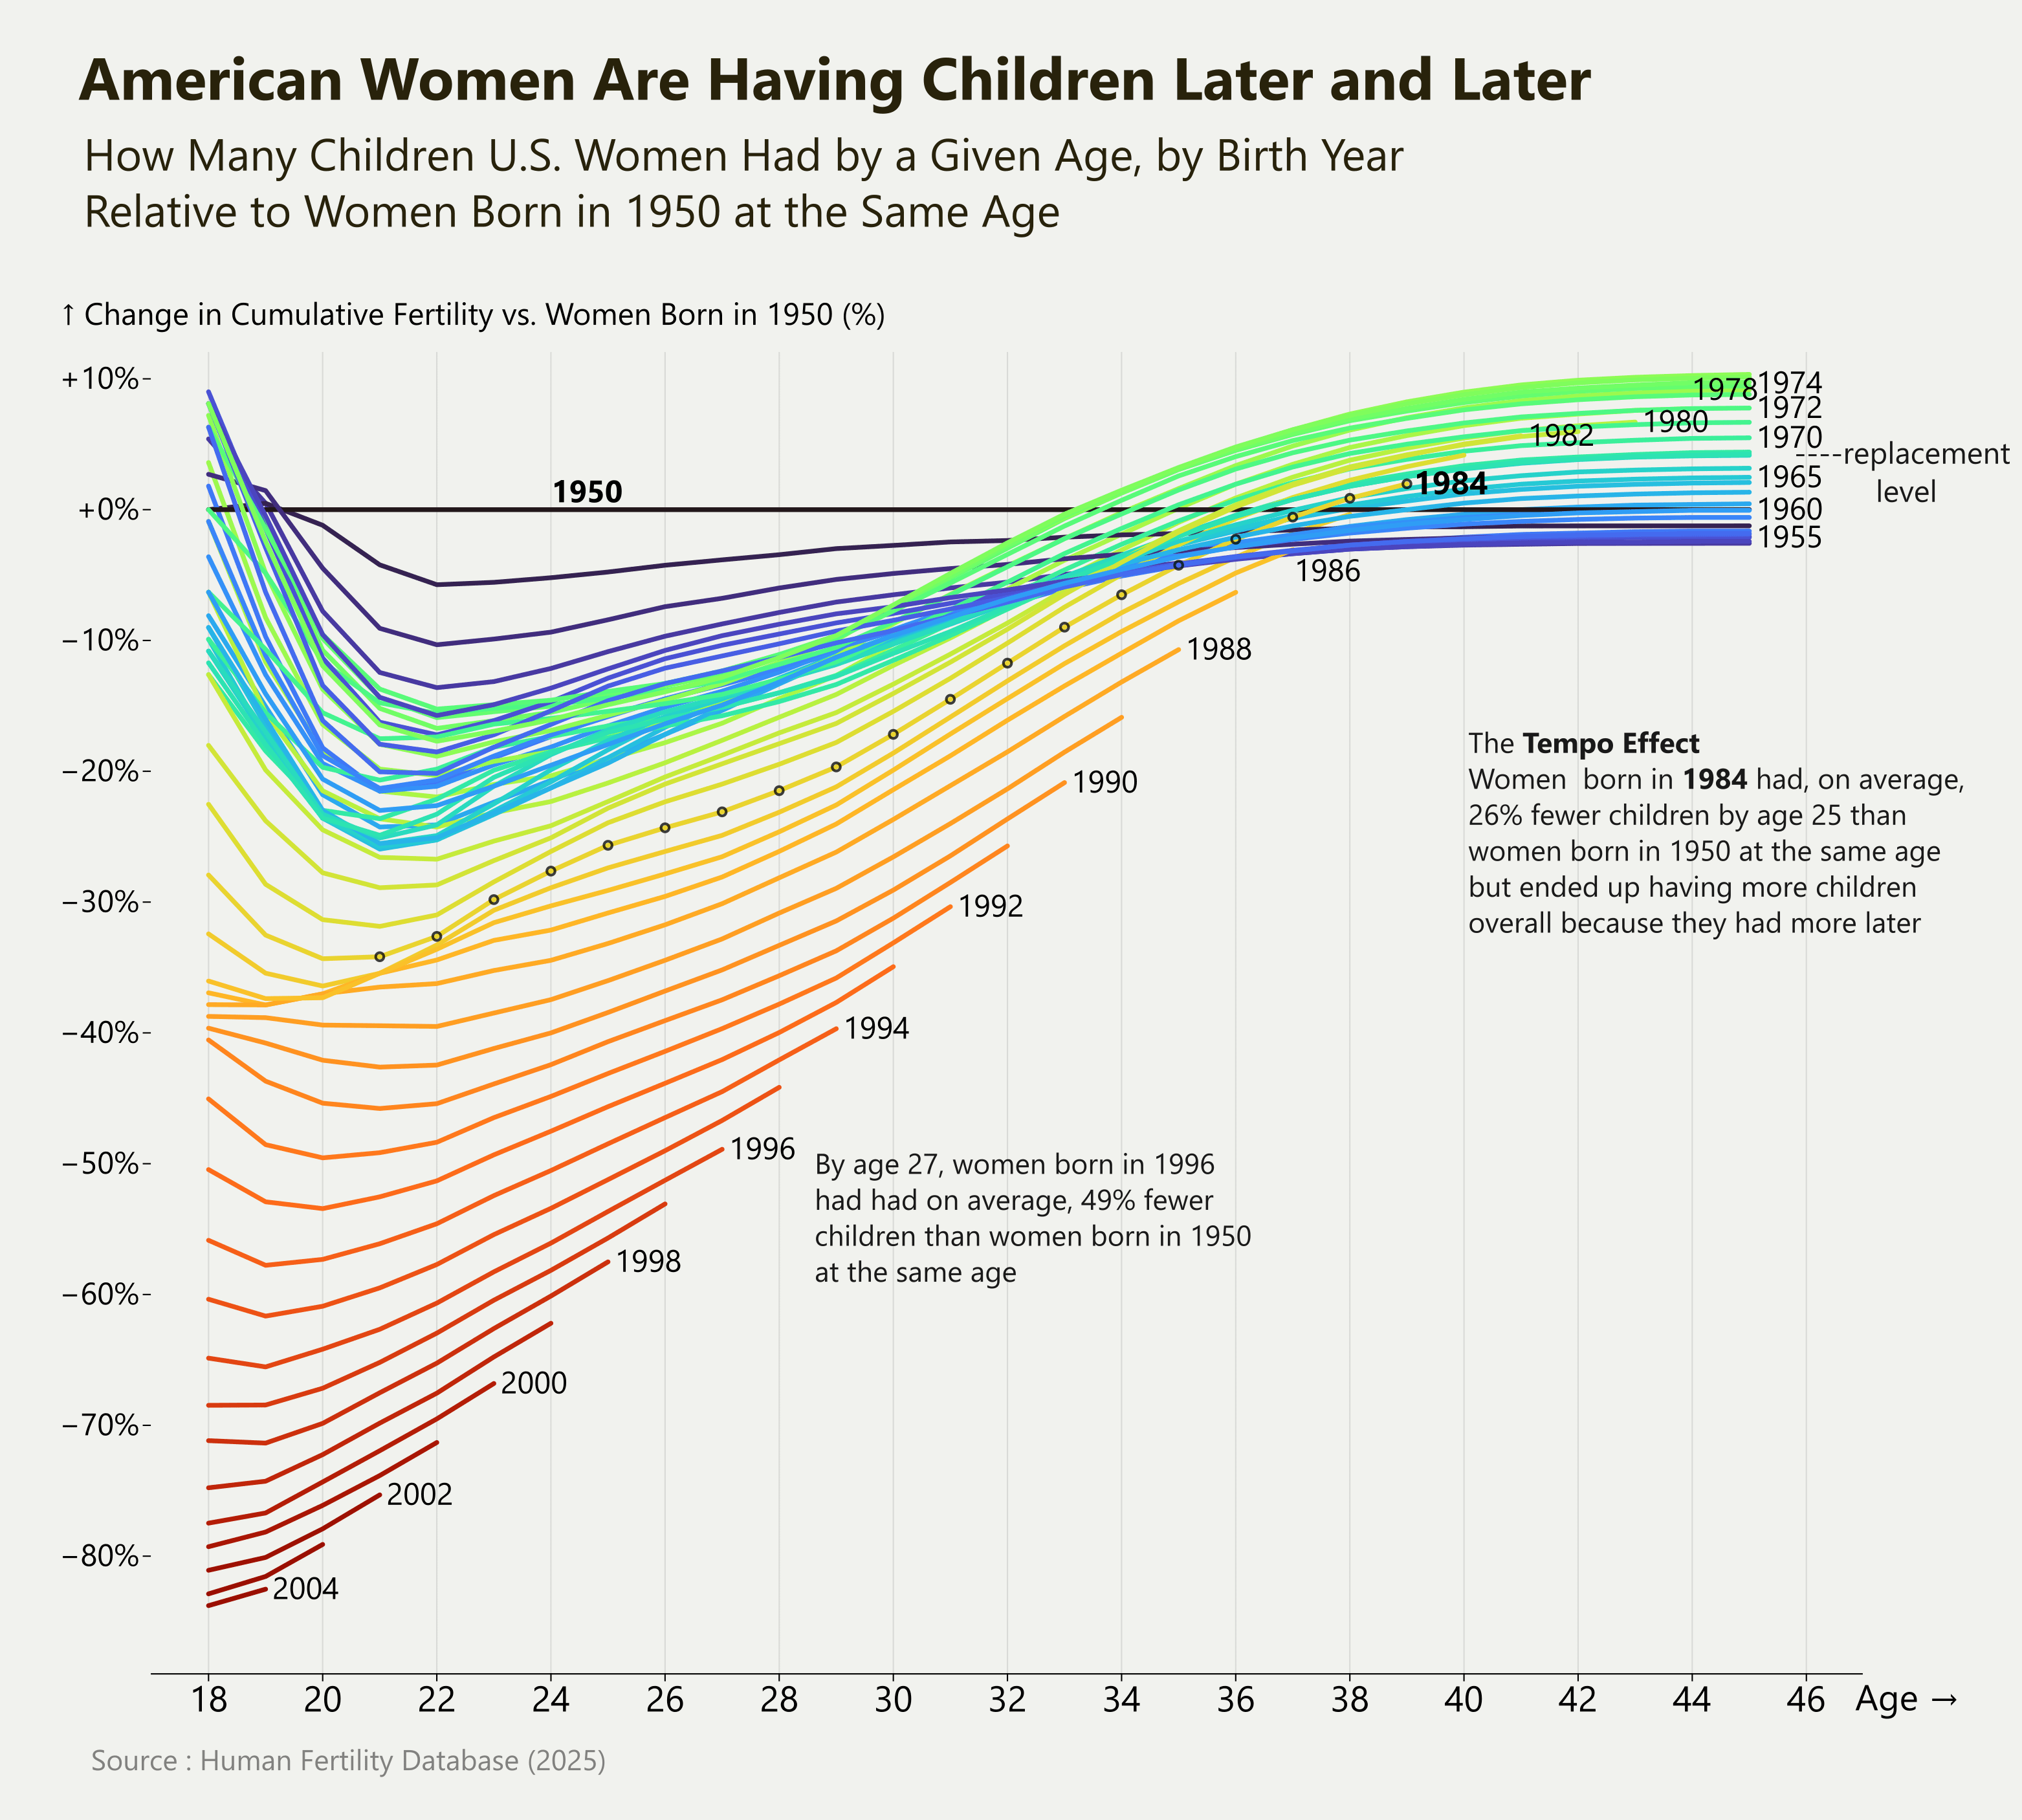
![[OC] American Women Are Having Children Later and Later](https://www.europesays.com/wp-content/uploads/2025/05/ro6f7wwbbx2f1-1920x1024.png)
27 comments
Source : [https://www.humanfertility.org/Country/Country?cntr=USA](https://www.humanfertility.org/Country/Country?cntr=USA) , the Cumulative fertility rates by Cohort dataset.
Tool : Observable Plot and Inkscape
Edit : for more explanations you can read this article with great visualizations here : [https://ourworldindata.org/total-fertility-rate-births-per-woman](https://ourworldindata.org/total-fertility-rate-births-per-woman)
No shit. The rentier economy and the ruling class are sucking every penny out of us for everything, and now they get more tax breaks on the backs of disabled and poor people.
I hate it here and I hate our conservative governments actively harming as many people as possible per bill.
Not American but yeah idk if it’ll happen for me. Can barely support myself
Our household views a child as a luxury good and we aren’t planning on trying for a child until we have secured our financial future through aggressive saving at a young age.
This chart takes a lot of effort to understand.
When women have access to education, legal rights, and birth control than time and again most women, like most men, choose to focus on their jobs, personal lives, and education before starting a family. That shouldn’t be surprising.
Women without options tend to have children younger. Which is also why modern women raised in fundementalist and conservative religions, are more likely to have children younger.
I would not have guessed that the highest total birth rate was for women born in 1974. That means there are quite a lot of Zoomers I guess.
1950 cohort is below replacement level?
This chart is a little confusing. But is the tempo effect basically saying women in 1984 had more kids than women in the 1950’s? I always thought the birth rate was declining.
This chart kinda defeats it’s purpose. Can’t understand
In the baby boom era really the best to compare to?
And this is why autism is on the rise. The longer we wait to have children the more likely our child will be born with a problem. Male and females produce less quality gametes as we age and our children pay the price.
Lots of really interesting information here:
-No idea that 1974 was “peak fertility” birth year for women
-Teen pregnancy is WAY down. This is fantastic news, but also seems to correlate strongly to lifetime fertility.
-Millennials are netting out to almost as fertile as boomers. Big surprise to me considering the headlines.
-Damn near linear decrease in fertility from Millennials onward.
Excellent visualization. No pixel is wasted IMO.
So while the Pyramdists panic that the fertility rate is going down, it’s not actually established that women are having fewer children over the full course of their lives, just that they’re not getting knocked up while still is school and while trying to establish their careers.
This graph is very confusing. What is “cumulative fertility”? The baseline is a 1950s woman, but how many kids are we talking about? An 80% decline means what, in real terms? What do the colors signify, proximity to current day? What is the dotted line?
I get that this is summarizing some complicated comparisons, but I’m not sure what this visualization is trying to illuminate.
I was born in 1953 and my Mom was 22. My son’s wife just had their first child and they’re 31.
what the fuck is this graph
Finally a data illustration that’s not just colorful and displays a clear trend but actually has a title, labeled X/Y, labeled data lines, a source, and relevant insights.
Okay, so yes, it takes a while to get what the graph is showing. But once you do, it’s a lot of really interesting info displayed in a very neat way.
It’s cool though, they get to join the soul sucking work force and be empowered.
This data presentation is bad not beautiful
This is actually beautiful
Sorry but this chart is ugly
To quote James Carville
“It’s the economy, stupid”
Can you project this to the population?
Less teen pregnancies LETS FUCKING GOOO
I’m so glad the wife and I bucked this trend. It’s not for everyone but having kids young worked out really well for us.
Comments are closed.