This is so fun, it doesn’t even have a time axis but makes sense nonetheless
This must be sustainable, I cant see a problem with this
/s
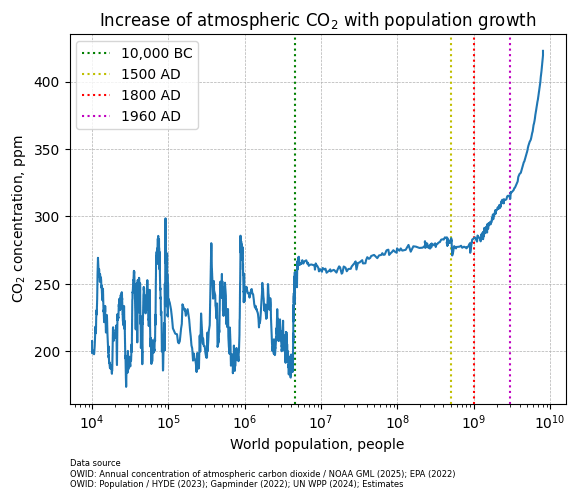
Has less to do with population growth and more to do with the Industrial Revolution, coal burning factories and coal burning for home warmth, and then oil and the combustible engines
…and yet the percentage of people responsible for most of the increase is relatively small.
The decline around 1500 AD is attributed to the large number of deaths that followed the discovery of America (mainly due to disease).
what happened 10000bc that made co2 steady rather than previous pattern?
Fossil fuels —> plentiful food etc —> population growth —> CO2 emissions
10k BC is the end of the last Ice Age right? What’s going on here with the change in behavior of CO2 level there?
Most people are gonna be looking at what happens when there’s more than 1 billion people in the world. I am wondering what happens when there’s less than 10 million people in the world
This is an atrocity. Just gonna act like the x-axis units are linear I guess
Correlation and causation are two different things. Do the same with the population of chickens and, surprise surprise, you’ll get the same, bloody chickens causing climate change
It’s clear that the sharp rise in CO₂ concentration is closely correlated with population growth, but more specifically with industrialization and fossil fuel usage. so it’s not population alone that drives CO₂ increases, but the activities associated with modern economies as population scales up.
I wonder what this would look like if we could cut the data by country and look at countries where they have implemented policy shifts toward renewable energy?
Go back millions of years now.
repeat after me:
Correlation Is Not Causation
Question:
should graphs show correlation or causation?
does anyone know why it spikes so massively at 10^5 and 10^6? those are BIG spikes from back in the early BC’s which makes me wonder what specifically would cause that to happen?? perhaps large wars or something?
17 comments
Made with Python from
https://ourworldindata.org/grapher/population
https://ourworldindata.org/grapher/co2-long-term-concentration
Unregistered Potatocam 2
Is it super blurry for everyone else or just me?
This is so fun, it doesn’t even have a time axis but makes sense nonetheless
This must be sustainable, I cant see a problem with this
/s
Has less to do with population growth and more to do with the Industrial Revolution, coal burning factories and coal burning for home warmth, and then oil and the combustible engines
…and yet the percentage of people responsible for most of the increase is relatively small.
The decline around 1500 AD is attributed to the large number of deaths that followed the discovery of America (mainly due to disease).
what happened 10000bc that made co2 steady rather than previous pattern?
Fossil fuels —> plentiful food etc —> population growth —> CO2 emissions
10k BC is the end of the last Ice Age right? What’s going on here with the change in behavior of CO2 level there?
Most people are gonna be looking at what happens when there’s more than 1 billion people in the world. I am wondering what happens when there’s less than 10 million people in the world
This is an atrocity. Just gonna act like the x-axis units are linear I guess
Correlation and causation are two different things. Do the same with the population of chickens and, surprise surprise, you’ll get the same, bloody chickens causing climate change
It’s clear that the sharp rise in CO₂ concentration is closely correlated with population growth, but more specifically with industrialization and fossil fuel usage. so it’s not population alone that drives CO₂ increases, but the activities associated with modern economies as population scales up.
I wonder what this would look like if we could cut the data by country and look at countries where they have implemented policy shifts toward renewable energy?
Go back millions of years now.
repeat after me:
Correlation Is Not Causation
Question:
should graphs show correlation or causation?
does anyone know why it spikes so massively at 10^5 and 10^6? those are BIG spikes from back in the early BC’s which makes me wonder what specifically would cause that to happen?? perhaps large wars or something?
Comments are closed.