Regulation is perhaps one of the most heated societal topics on the table right now, but its prevalence in political debate should not let you mistake it for an opinion – regulation is necessary for a functioning society, and the lead epidemic serves as a reminder of that.
This is a graph I've been working on for a school outreach project about the importance of regulation and figured it would fit here, so any feedback would be appreciated. I do not claim to know for sure that lead is the cause of these societal issues but merely wanted to present the strong possibility that early life lead exposure could have.
Sources:
https://www.pnas.org/doi/10.1073/pnas.2118631119#supplementary-materials
https://pmc.ncbi.nlm.nih.gov/articles/PMC2721861/
https://www.disastercenter.com/crime/uscrime.htm (Sketchy looking, I know, but it matches up with other general data and is even mentioned by the Library of Congress as being from a reputable source, at the very least).
Lead-crime hypothesis – https://en.wikipedia.org/wiki/Lead%E2%80%93crime_hypothesis
Made in Canva
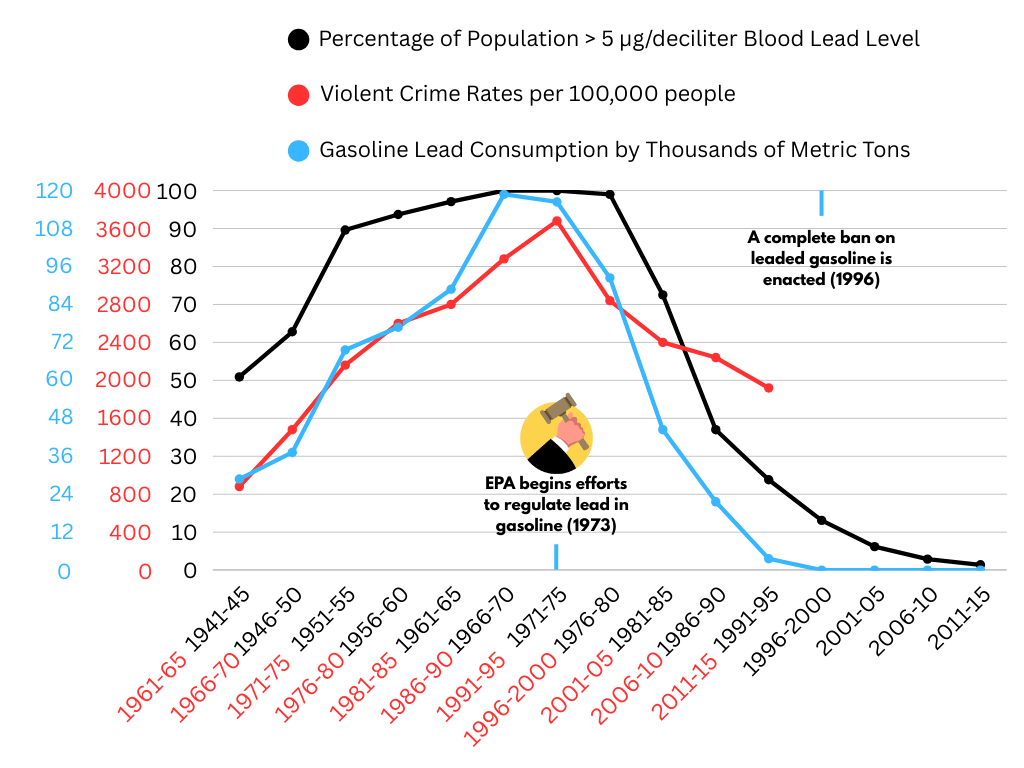
*The gasoline lead consumption is an approximation based on a chart from the first link, I could not find their source or a table for it, so it's based off of some careful measurements.
**The line for violent crime rates is displaced to the left to account for the fact that people are exposed to lead during childhood then (if the hypothesis is correct) grow up with developmental disorders and commit these crimes. It ends at 2015 since that's when the rest of the graph ends as well.
***All data points are in groups of 5 years instead of a year at a time, unfortunately it's all I could do given the data I had and is less precise than it could be.
I'm also not sure if the title counts as "sensationalized", it's simply the working headline for my final project in school and not meant to persuade or dissuade anyone of anything. It's a strong necessity that I include it in the title as it's the entire topic of my research and this post is a part of the project.
Posted by slimetakes
19 comments
It’s a fascinating hypothesis. Rate of backyard pool deaths also correlate exactly the number of movies Nic Cage makes a year.
I think this would be a super interesting entry for “Correlation doesn’t equal causation” graphs. But the reality is crime stems from hundreds of other factors.
Are there other countries that never had this early lead exposure that you can map this same trend? Or other countries that regulated this show the same trend?
Edit: fixed the correlation vs causation mishap
one of the least likely and dumbest theories in the first freakanomics book
i think pinker does a good job debunking it in better angels of our nature, or at least expanding on the complexity of the issue
a much larger impact can be tied to the drop in ipv after the vawa in the 90s, of course because you’ve tried to massage how the data looks with the scale, difficult to tell that the drop in violence of the 90s was significant at all with this manipulated data, par for the course for this sub tho
Well this is just three *correlating* measurements, what makes you think there is causation except that it “looks like it”, which is just down to randomness.
Roe v Wade (also 1973) might have also had an impact on this data as it allowed people that would have otherwise had children growing up in impoverished households to abort the fetus and thus could be another hypothesis for why crime reversed it’s rising trend
Okay this clearly is not how you want to do this. If you want to look at this then develop a hypothesis. Do you think violent crimes are related to leaded gasoline consumption? Related how? Linearly? Model a linear regression. You think there may be other factors at play? Add them as covariates. Do you think time is a factor? Adjust for time. Look for interactions between your covariates. Do a formal statistical analysis. Plotting partially or completely unrelated data may give you some correlation but that doesn’t give you any real information. Especially to support your argument for regulation.
I read that there is a state-by-state effect you can track in “the real criminal element” article in mother jones (?) but I have never seen it shown. Would love to see that.
Should also note, its not completely banned. It’s still, in 2025, used in airplane engines and dusted all over lower income neighborhoods.
There is a YT documentary called: The man that killed more people than Hitler or something close to that I saw a few years ago. It was about the man that invented Leaded Gas and conned the world.
Was pretty Interesting.
Thank god they’re all still in charge.
Ah, the “what are we blaming people’s actions on today” post.
you couldn’t google violent crime rate after 2015?
This is an interesting and plausible hypothesis, but by themselves these graphs provide almost zero evidentiary value for it. There are far too many factors that could _potentially_ influence crime rates, so logic dictates that at least one of them is highly likely to appear to strongly correlate (the XKCD jellybeans fallacy). What would provide better evidence would be a breakdown by state or county to show whether particular areas with higher rates of lead exposure also had higher crime rates. That would demonstrate a real correlation, and give at least _some_ small evidence for causation.
This really gives the same vibes as the fewer pirates causes global warming thing
This graph is meaningless unless there’s data to show that violent criminals have elevated lead compared to the rest of the population
Violent crime drops before lead levels in blood drop.
This graph is a great example of “if you torture the data enough, it will confess”.
The timeline is shifted, the axes were deliberately chosen to make the decline look propotional, and for some reason the 16′-20′ data point got removed probably because the decline stops and the correlation is no longer there.
Am I the only one who can’t get over the doubled up X axis that makes no sense? Hypothesis aside, This data is far from beautiful.
You don’t have to draw a particularly long bow to illustrate your point about the importance of regulation. 1950’s Seat belt law vs fatal car accidents, 1990’s childhood asthma in LA vs smog laws. 1800’s fire codes vs fire deaths. There’s a million examples. The most significant in our lifetime affect corporations. Shipping safety standards vs oil spills springs to mind
This explains why my grandparents and great grandparents were deeply afraid of almost all people that weren’t family.
Comments are closed.