
May 26, 2025
IndexBox has just published a new report: Northern America – Pastels, Drawing Charcoals, Writing Or Drawing Chalks – Market Analysis, Forecast, Size, Trends And Insights.
The article discusses the expected upward trend in the drawing chalk market in Northern America, with a forecasted increase in market volume to 21K tons and market value to $100M by 2035. The anticipated CAGR for both volume and value reflects a positive outlook for the market over the next decade.
Market Forecast
Driven by rising demand for drawing chalk in Northern America, the market is expected to start an upward consumption trend over the next decade. The performance of the market is forecast to increase slightly, with an anticipated CAGR of +0.5% for the period from 2024 to 2035, which is projected to bring the market volume to 21K tons by the end of 2035.
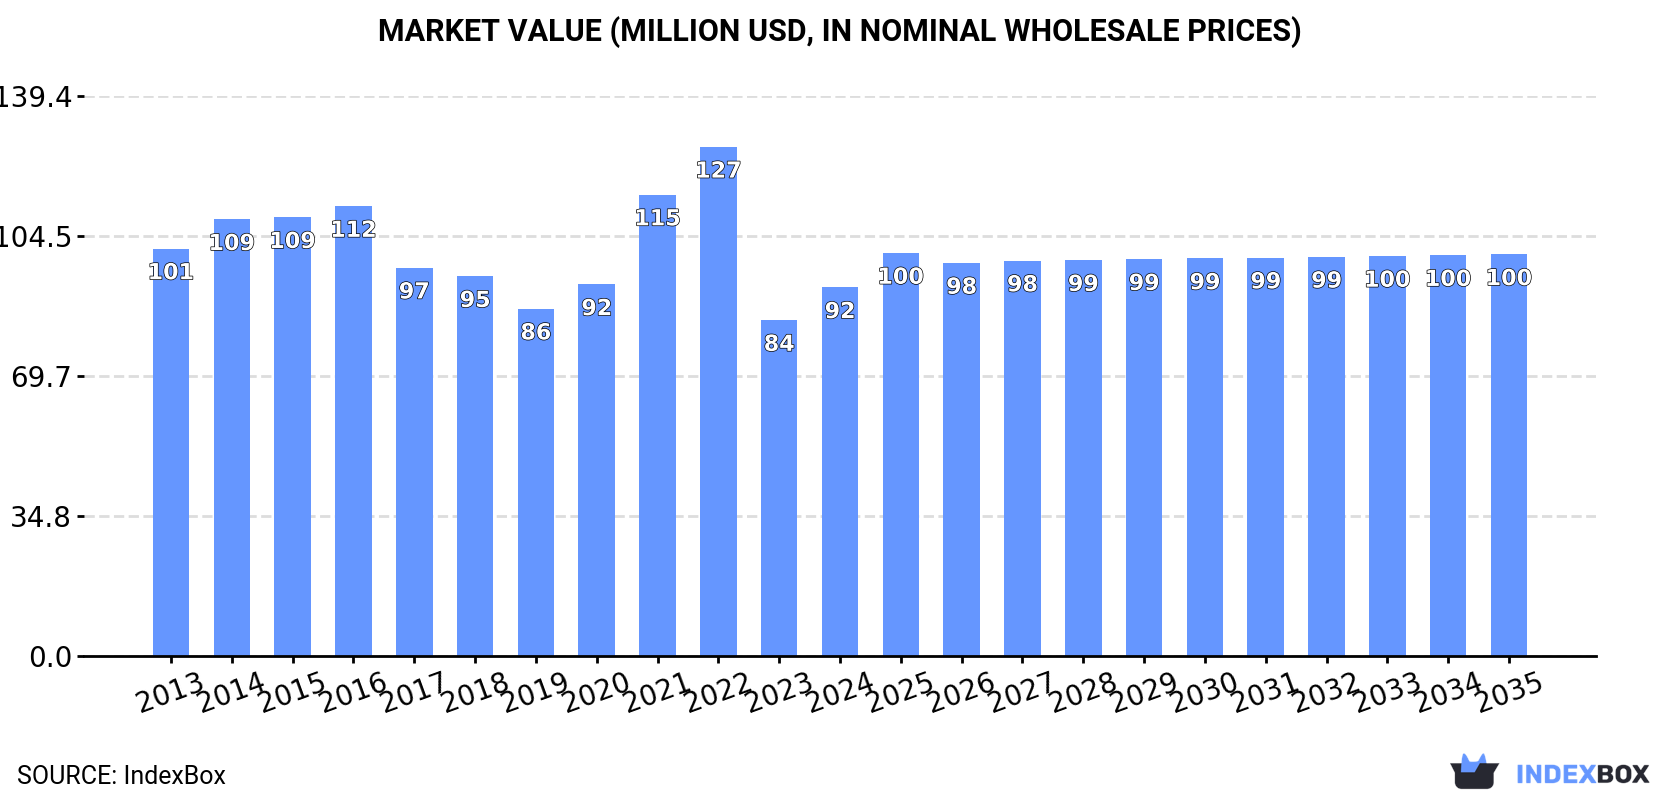
In value terms, the market is forecast to increase with an anticipated CAGR of +0.8% for the period from 2024 to 2035, which is projected to bring the market value to $100M (in nominal wholesale prices) by the end of 2035.
 ConsumptionNorthern America’s Consumption of Pastels, Drawing Charcoals, Writing Or Drawing Chalks
In 2024, approx. 20K tons of pastels, drawing charcoals, writing or drawing chalks were consumed in Northern America; growing by 13% compared with the previous year’s figure. Over the period under review, consumption, however, saw a relatively flat trend pattern. Over the period under review, consumption attained the peak volume at 29K tons in 2022; however, from 2023 to 2024, consumption stood at a somewhat lower figure.
The size of the drawing chalk market in Northern America expanded notably to $92M in 2024, growing by 9.7% against the previous year. This figure reflects the total revenues of producers and importers (excluding logistics costs, retail marketing costs, and retailers’ margins, which will be included in the final consumer price). In general, consumption, however, showed a relatively flat trend pattern. The level of consumption peaked at $127M in 2022; however, from 2023 to 2024, consumption failed to regain momentum.
Consumption By Country
The United States (18K tons) constituted the country with the largest volume of drawing chalk consumption, comprising approx. 89% of total volume. Moreover, drawing chalk consumption in the United States exceeded the figures recorded by the second-largest consumer, Canada (2.2K tons), eightfold.
In the United States, drawing chalk consumption remained relatively stable over the period from 2013-2024.
In value terms, the United States ($81M) led the market, alone. The second position in the ranking was held by Canada ($11M).
In the United States, the drawing chalk market remained relatively stable over the period from 2013-2024.
The countries with the highest levels of drawing chalk per capita consumption in 2024 were Canada (55 kg per 1000 persons) and the United States (53 kg per 1000 persons).
From 2013 to 2024, the most notable rate of growth in terms of consumption, amongst the leading consuming countries, was attained by the United States (with a CAGR of -0.8%).
ImportsNorthern America’s Imports of Pastels, Drawing Charcoals, Writing Or Drawing Chalks
In 2024, approx. 21K tons of pastels, drawing charcoals, writing or drawing chalks were imported in Northern America; surging by 9.4% compared with 2023 figures. In general, imports, however, recorded a relatively flat trend pattern. The most prominent rate of growth was recorded in 2021 when imports increased by 25%. The volume of import peaked at 31K tons in 2022; however, from 2023 to 2024, imports failed to regain momentum.
In value terms, drawing chalk imports amounted to $97M in 2024. Overall, imports, however, saw a slight curtailment. The most prominent rate of growth was recorded in 2021 with an increase of 25% against the previous year. The level of import peaked at $133M in 2022; however, from 2023 to 2024, imports stood at a somewhat lower figure.
Imports By Country
In 2024, the United States (19K tons) represented the major importer of pastels, drawing charcoals, writing or drawing chalks, comprising 90% of total imports. It was distantly followed by Canada (2.2K tons), committing a 10% share of total imports.
The United States experienced a relatively flat trend pattern with regard to volume of imports of pastels, drawing charcoals, writing or drawing chalks. Canada (-1.2%) illustrated a downward trend over the same period. The shares of the largest importers remained relatively stable throughout the analyzed period.
In value terms, the United States ($85M) constitutes the largest market for imported pastels, drawing charcoals, writing or drawing chalks in Northern America, comprising 88% of total imports. The second position in the ranking was held by Canada ($11M), with a 12% share of total imports.
From 2013 to 2024, the average annual growth rate of value in the United States stood at -1.8%.
Import Prices By Country
The import price in Northern America stood at $4,510 per ton in 2024, reducing by -3.1% against the previous year. Over the period under review, the import price showed a relatively flat trend pattern. The growth pace was the most rapid in 2014 when the import price increased by 10% against the previous year. As a result, import price reached the peak level of $5,396 per ton. From 2015 to 2024, the import prices failed to regain momentum.
Average prices varied noticeably amongst the major importing countries. In 2024, amid the top importers, the country with the highest price was Canada ($5,177 per ton), while the United States amounted to $4,433 per ton.
From 2013 to 2024, the most notable rate of growth in terms of prices was attained by Canada (+0.4%).
ExportsNorthern America’s Exports of Pastels, Drawing Charcoals, Writing Or Drawing Chalks
In 2024, drawing chalk exports in Northern America dropped rapidly to 1.3K tons, which is down by -25.3% compared with the previous year’s figure. Over the period under review, exports recorded a abrupt downturn. The most prominent rate of growth was recorded in 2021 when exports increased by 41%. Over the period under review, the exports hit record highs at 3.8K tons in 2014; however, from 2015 to 2024, the exports remained at a lower figure.
In value terms, drawing chalk exports declined modestly to $23M in 2024. The total export value increased at an average annual rate of +1.8% from 2013 to 2024; however, the trend pattern remained consistent, with only minor fluctuations being observed in certain years. The pace of growth was the most pronounced in 2016 with an increase of 16%. The level of export peaked at $24M in 2018; however, from 2019 to 2024, the exports stood at a somewhat lower figure.
Exports By Country
The United States prevails in exports structure, accounting for 1.3K tons, which was approx. 96% of total exports in 2024. Canada (58 tons) held a little share of total exports.
Exports from the United States decreased at an average annual rate of -7.5% from 2013 to 2024. Canada experienced a relatively flat trend pattern. While the share of Canada (+2.3 p.p.) increased significantly in terms of the total exports from 2013-2024, the share of the United States (-2.3 p.p.) displayed negative dynamics.
In value terms, the United States ($23M) remains the largest drawing chalk supplier in Northern America, comprising 98% of total exports. The second position in the ranking was taken by Canada ($466K), with a 2% share of total exports.
In the United States, drawing chalk exports increased at an average annual rate of +1.8% over the period from 2013-2024.
Export Prices By Country
The export price in Northern America stood at $17,478 per ton in 2024, with an increase of 33% against the previous year. Overall, the export price continues to indicate a resilient increase. The pace of growth was the most pronounced in 2020 when the export price increased by 78% against the previous year. The level of export peaked in 2024 and is expected to retain growth in the immediate term.
Prices varied noticeably by country of origin: amid the top suppliers, the country with the highest price was the United States ($17,913 per ton), while Canada amounted to $8,047 per ton.
From 2013 to 2024, the most notable rate of growth in terms of prices was attained by the United States (+10.1%).