
By John Richardson
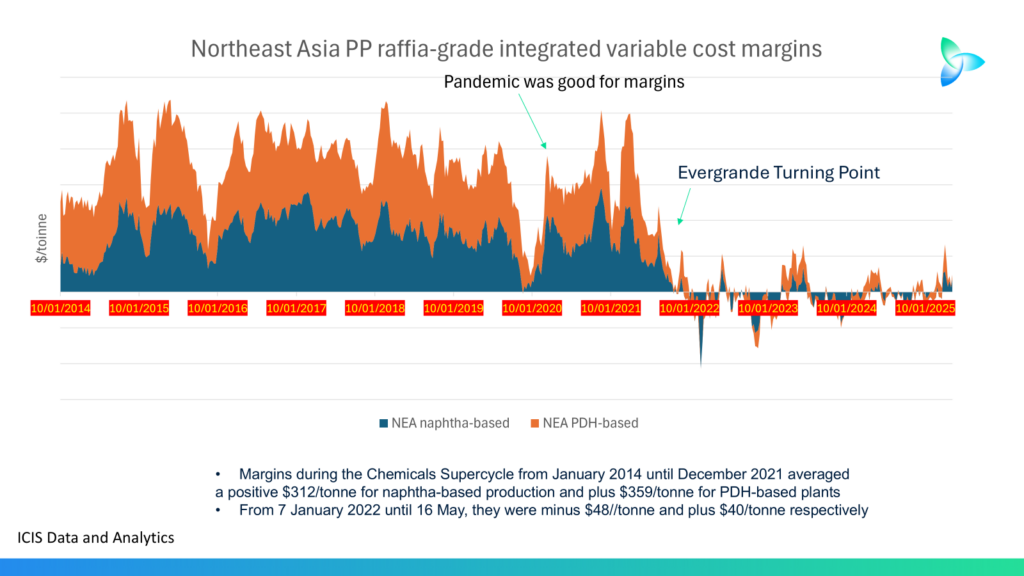
I COULD PRESENT a dozen or so charts such as the one above—for example, for the three grades of polyethylene (PE), for ethylene, for propylene, and for styrene—and the patterns would be the same, although, of course, the numbers would be different.
While the pandemic dented demand growth in some countries and regions, this was not the case in China, where polypropylene (PP) consumption growth in 2020 jumped to 9% from 7% the year before and remained a healthy 7% in 2021. The pattern was the same in other chemicals and polymers.
The stronger demand was the “China in, China out” story: Rising imports of chemicals and polymers to manufacture the finished goods that cash-rich and bored Westerners were purchasing during lockdowns, funded by government handouts.
Stronger demand obviously bolstered the margins you can see on the above chart. So did a shortage of feedstocks from refineries, as refineries were running at lower operating rates due to the impact of the lockdowns on demand for transportation fuels.
Then, as chart after chart from ICIS Data and Analytics shows us, early 2022 was the turning point due to a combination of the Evergrande Turning Point, China’s constantly deteriorating demographics, and a government-driven petrochemicals self-sufficiency push that began in 2014.
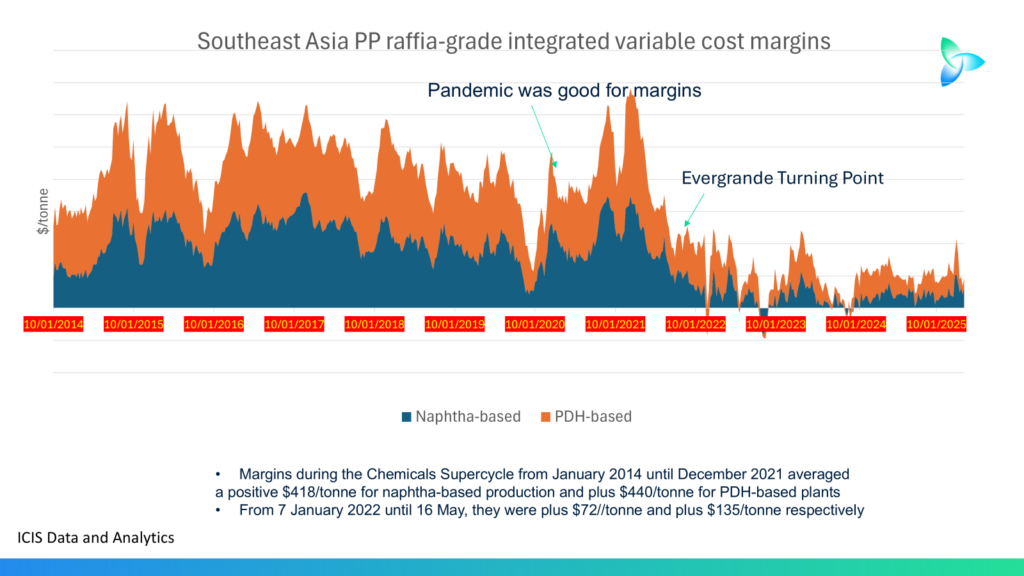
Here is a second chart, again featuring raffia-grade PP production via naphtha cracking and the PDH process, but this time focusing on Southeast Asia. The decline in margins in this region is not as severe as in Northeast Asia, as is the case across many products, but the region is still facing historically low profitability.
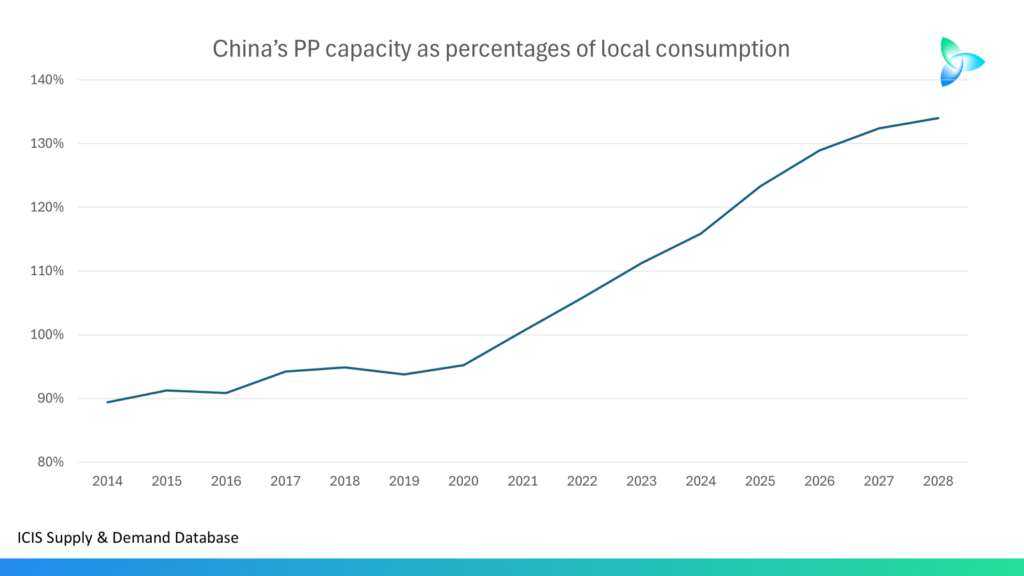
China’s PP Self-Sufficiency and Export Expansion
On China’s self-sufficiency and focusing on PP again, one of the most affected products, the chart below estimates that China’s capacity as a percentage of local demand is projected to rise from 89% in 2014 to 134% in 2028.
None of these fundamentals are about the trade war. They were in play before the trade war and will remain so if the trade war comes to an end.
Whether the trade war has to date made any difference to China’s exports of PP is hard to discern. Maybe we were always going to see a sharp rise in exports this year, given that China’s PP capacity as a percentage of demand is forecast to rise to 123% from 116% in 2024.
As recently as 2020, China’s exports of PP totalled less than 500,000 tonnes. In 2023, they reached around 1.3 million tonnes bef
ore jumping to 2.4 million tonnes in 2024. The ICIS Supply & Demand data for January–April 2025 suggest the following:
If the January–April numbers are annualised, involving dividing by four and multiplying by 12, this points to China’s full-year 2025 exports reaching around 3.1 million tonnes.
China’s exports to the ASEAN member countries, historically its biggest destination for PP (Brunei, Cambodia, Indonesia, Laos, Malaysia, Myanmar, the Philippines, Singapore, Thailand, and Vietnam), totalled approximately 900,000 tonnes. If the January–April 2025 trends were to continue, China’s full-year 2025 exports to ASEAN would reach more than 1 million tonnes.
Trade War Impact Remains Unclear
Sentiment is one thing—an instant thing—and the excellent ICIS pricing editors have been reflecting the shifts in sentiment, back and forth between the negative and the positive, since 2 April’s “Liberation Day”.
The change in mood has, of course, affected pricing patterns and chemicals and polymers buying patterns. This will surely continue because ongoing US trade negotiations with 88 different countries and trading blocs such as the EU are bound to create more volatility. Uncertainty is going to be layered on uncertainty.
But the underlying fundamentals, even if the trade war were to go away, cannot change.
The Chemicals Supercycle is over. What will replace the Supercycle, nobody really understands, as I discussed last week.