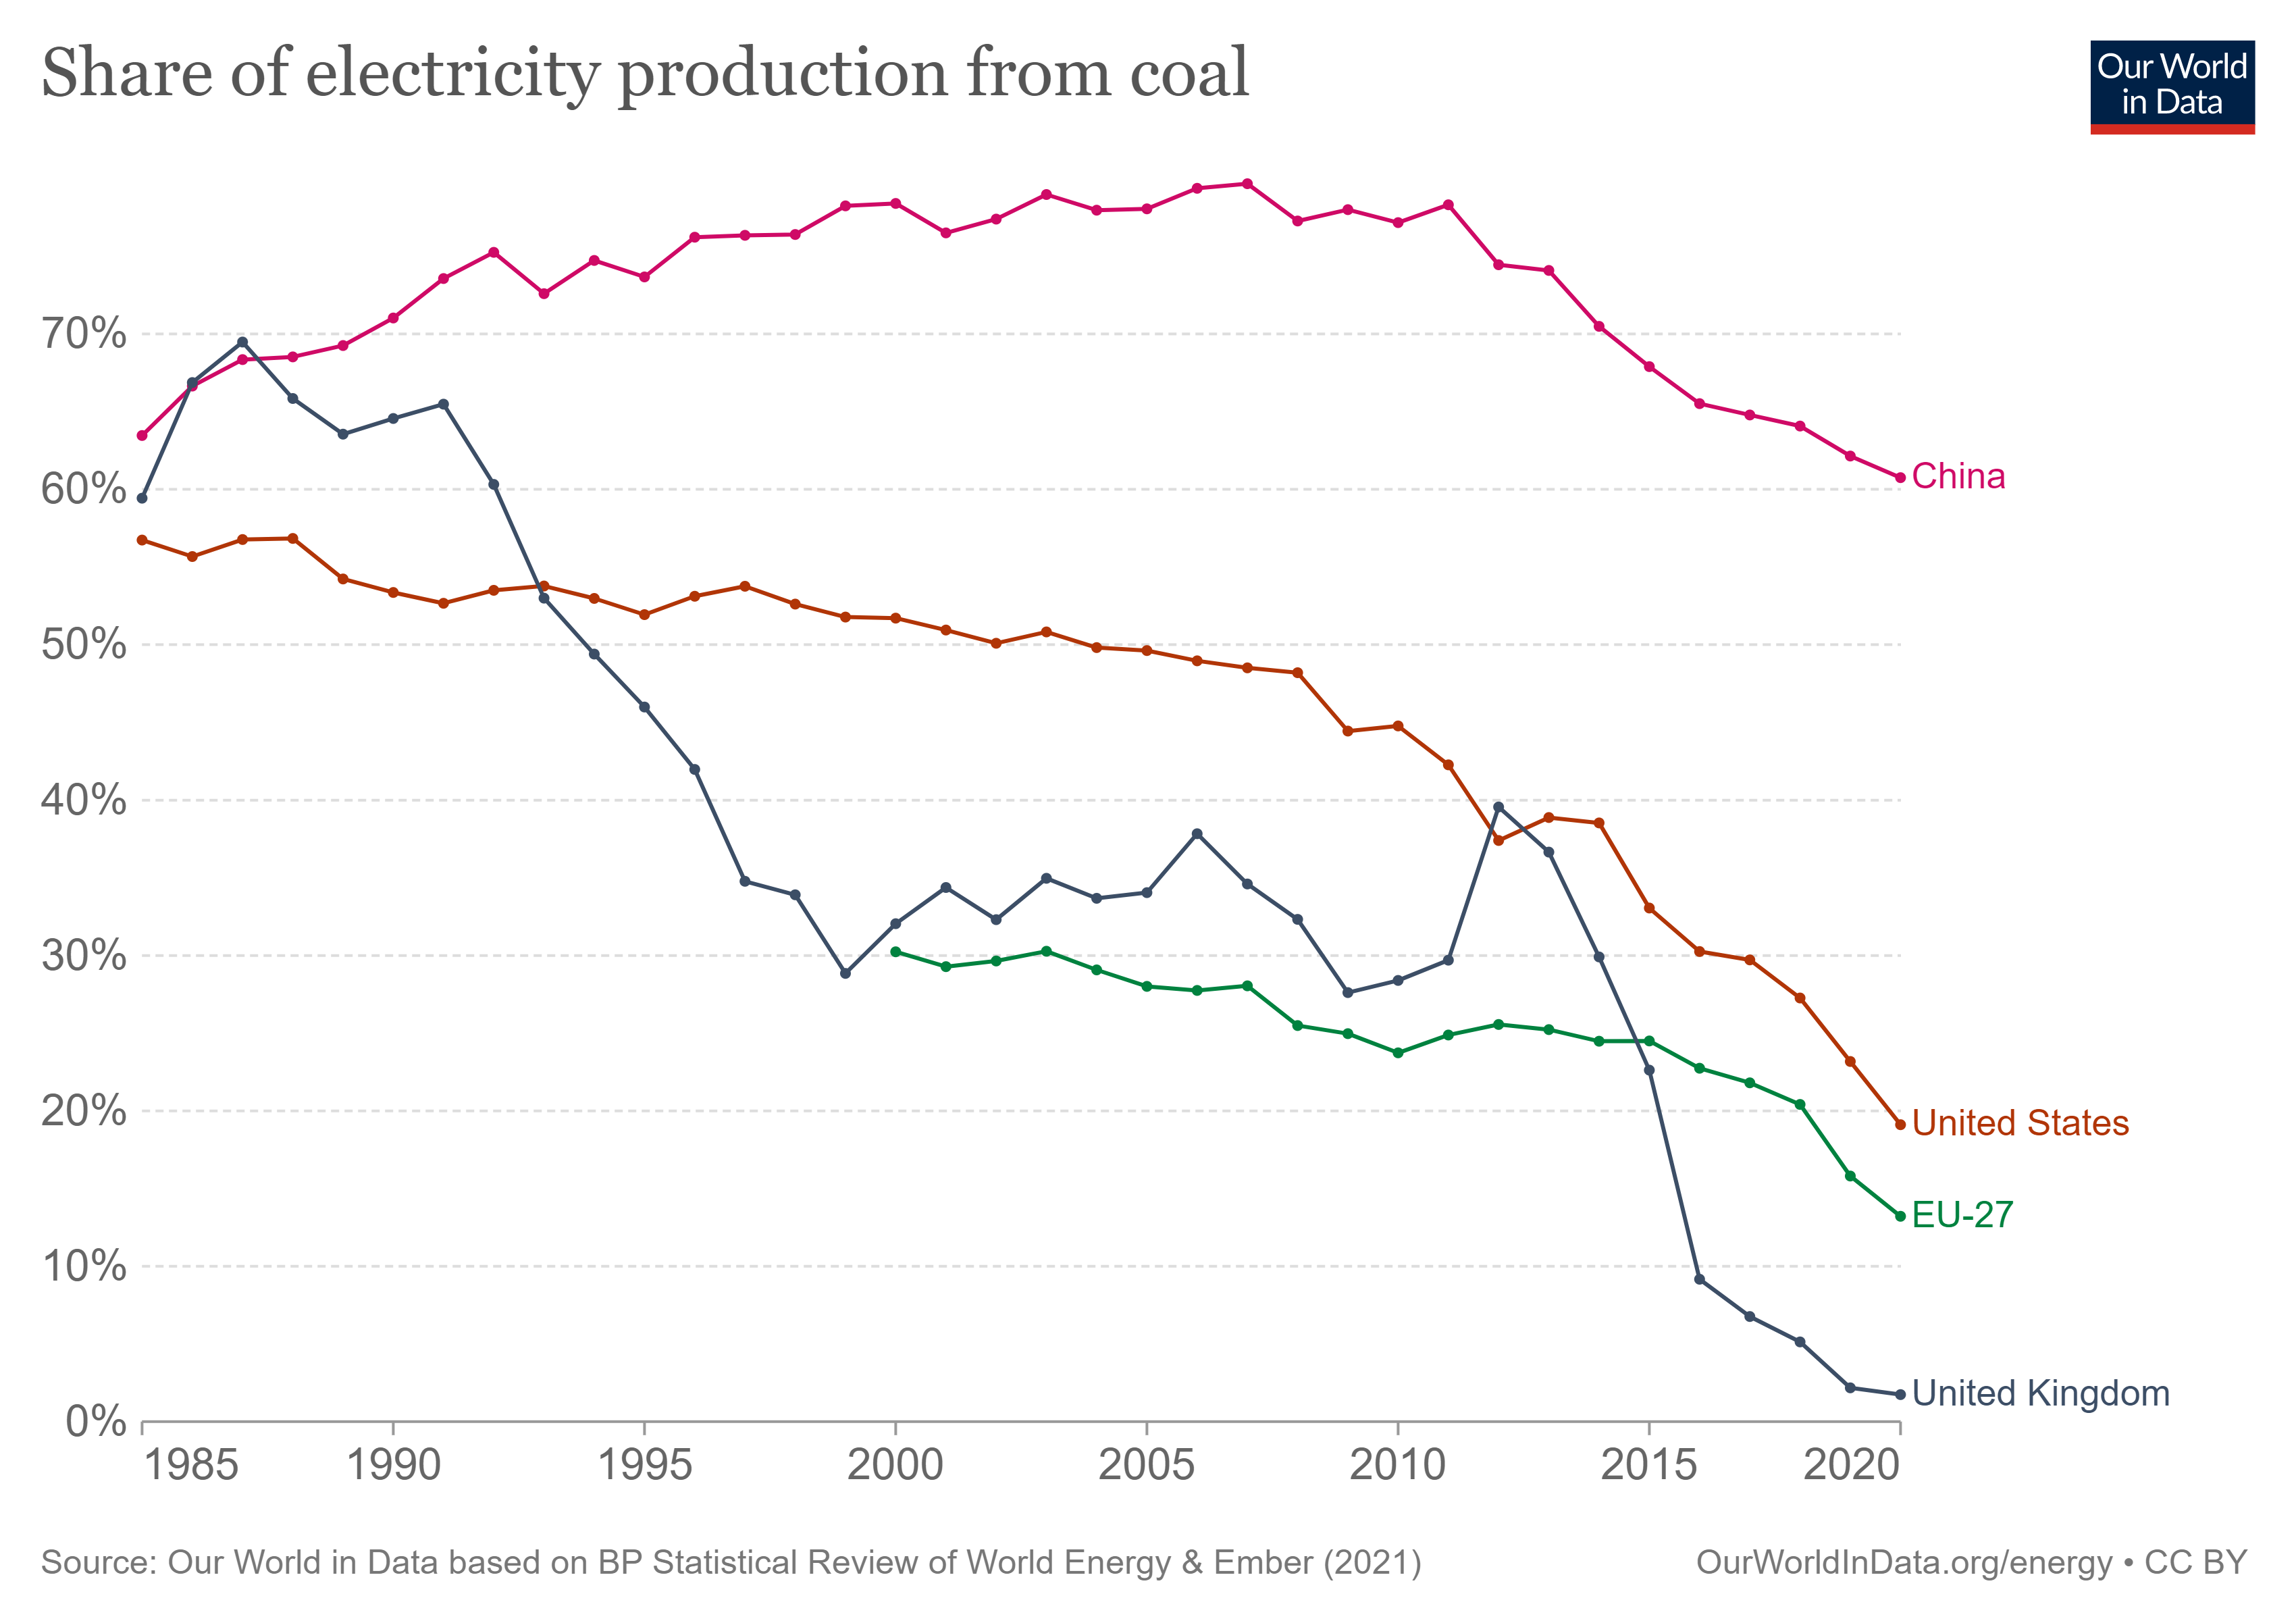
I had no idea the US was doing almost as well as the EU.
I’ll take my downvotes now.
I am amazed at how UK turned the fact they’re an isolated island into wind and hydroelectric power!
Take that Greta!
Three comments why the graph is misleading to many:
1. Relative numbers tell only a small part of the story. Here is the same graph with absolute numbers https://ourworldindata.org/grapher/electricity-coal?tab=chart&time=earliest..latest&country=USA~IND~ZAF~JPN~DEU~SWE~EU-27~CHN~OWID_WRL.
2. Many of the coal intensive industries have shifted from EU/US to Asia. They are producing our goods and gadgets.
3. Electricity is of course just part of the story. When looking at decarbonization, we should be looking at the absolute energy produced by source.
Wonder where Russia would be on this
Blows my mind that less than a decade ago 40% of electricity was produced from coal in US and UK. For some reason I always thought it was much less.
So, what happened between ~2012 and ~2016 in the UK for such a success?
That drop from 22% in 2015 to 9% in 2016 is crazy and all it took was the government setting a deadline to end coal by 2025 (now revised to 2024).
Now, show the same graph for all co2 intensive sources, including natural gas. I guess natural gas went up a lot recently.
Coal keeps the lights on-West Virginia
Chairman Pooh has already declared on the world’s environment
Now compare the different countries together because Germany and France are definitely not doing the same
Not the most informative graph. China may have reduced their share of coal electricity but in absolute numbers it keeps hitting new records every year.
Would be interesting to see the whole data since industrial revolution and not started somewhere in the 90s
If you are quiet you can hear Australians freak out.
Share is probably not a good unit in this case. Perhaps absolute numbers in TWh would be better.
So from 2004, where 1,700 TWh where made from coal, it went up to 4,500 TWh.
For the UK, on the other hand, coal consumption dropped from 3 quadrillion BTU down to ~1.2 quadrillion BTU.
Based, from single digits to almost half of our electricity being renewable in just a decade, apparently we got one thing right, makes a nice change, this is one thing I’m very proud of.
Amazing job UK!
Why electricity production from coal dropped so much, even before people became concerned with global warming? Isn’t that the cheapest source?
How much for gaz today ?
Wondering why the energy is super expensive?
Well, we know now where are industries.
Sooo, when will climate change protests in China start since they have the biggest environmental impact?

26 comments
source:[https://ourworldindata.org/grapher/share-electricity-coal?tab=chart&country=CHN~GBR~USA~EU-27](https://ourworldindata.org/grapher/share-electricity-coal?tab=chart&country=CHN~GBR~USA~EU-27)
I had no idea the US was doing almost as well as the EU.
I’ll take my downvotes now.
I am amazed at how UK turned the fact they’re an isolated island into wind and hydroelectric power!
Take that Greta!
Three comments why the graph is misleading to many:
1. Relative numbers tell only a small part of the story. Here is the same graph with absolute numbers https://ourworldindata.org/grapher/electricity-coal?tab=chart&time=earliest..latest&country=USA~IND~ZAF~JPN~DEU~SWE~EU-27~CHN~OWID_WRL.
2. Many of the coal intensive industries have shifted from EU/US to Asia. They are producing our goods and gadgets.
3. Electricity is of course just part of the story. When looking at decarbonization, we should be looking at the absolute energy produced by source.
Wonder where Russia would be on this
Blows my mind that less than a decade ago 40% of electricity was produced from coal in US and UK. For some reason I always thought it was much less.
So, what happened between ~2012 and ~2016 in the UK for such a success?
That drop from 22% in 2015 to 9% in 2016 is crazy and all it took was the government setting a deadline to end coal by 2025 (now revised to 2024).
Now, show the same graph for all co2 intensive sources, including natural gas. I guess natural gas went up a lot recently.
Coal keeps the lights on-West Virginia
Chairman Pooh has already declared on the world’s environment
Now compare the different countries together because Germany and France are definitely not doing the same
Not the most informative graph. China may have reduced their share of coal electricity but in absolute numbers it keeps hitting new records every year.
Would be interesting to see the whole data since industrial revolution and not started somewhere in the 90s
If you are quiet you can hear Australians freak out.
Share is probably not a good unit in this case. Perhaps absolute numbers in TWh would be better.
China, for instance, increased it’s energy production from 500 TWh in 1985 to more than 7000 TWh in 2020. [https://en.wikipedia.org/wiki/Electricity_sector_in_China](https://en.wikipedia.org/wiki/Electricity_sector_in_China)
So from 2004, where 1,700 TWh where made from coal, it went up to 4,500 TWh.
For the UK, on the other hand, coal consumption dropped from 3 quadrillion BTU down to ~1.2 quadrillion BTU.
Based, from single digits to almost half of our electricity being renewable in just a decade, apparently we got one thing right, makes a nice change, this is one thing I’m very proud of.
Amazing job UK!
Why electricity production from coal dropped so much, even before people became concerned with global warming? Isn’t that the cheapest source?
How much for gaz today ?
Wondering why the energy is super expensive?
Well, we know now where are industries.
Sooo, when will climate change protests in China start since they have the biggest environmental impact?
Thanks miss Thatcher! (Kinda /s)
Yeah and the other countries don’t exist lol