
Jun 5, 2025
IndexBox has just published a new report: United Kingdom – Graphic Papers – Market Analysis, Forecast, Size, Trends and Insights.
The graphic papers market in the UK is set to experience a slight increase in performance, with a forecasted CAGR of +1.9% in volume and +2.2% in value from 2024 to 2035. This growth is expected to be fueled by rising demand, leading to a significant expansion in market size by the end of the forecast period.
Market Forecast
Driven by rising demand for graphic papers in the UK, the market is expected to start an upward consumption trend over the next decade. The performance of the market is forecast to increase slightly, with an anticipated CAGR of +1.9% for the period from 2024 to 2035, which is projected to bring the market volume to 2.7M tons by the end of 2035.
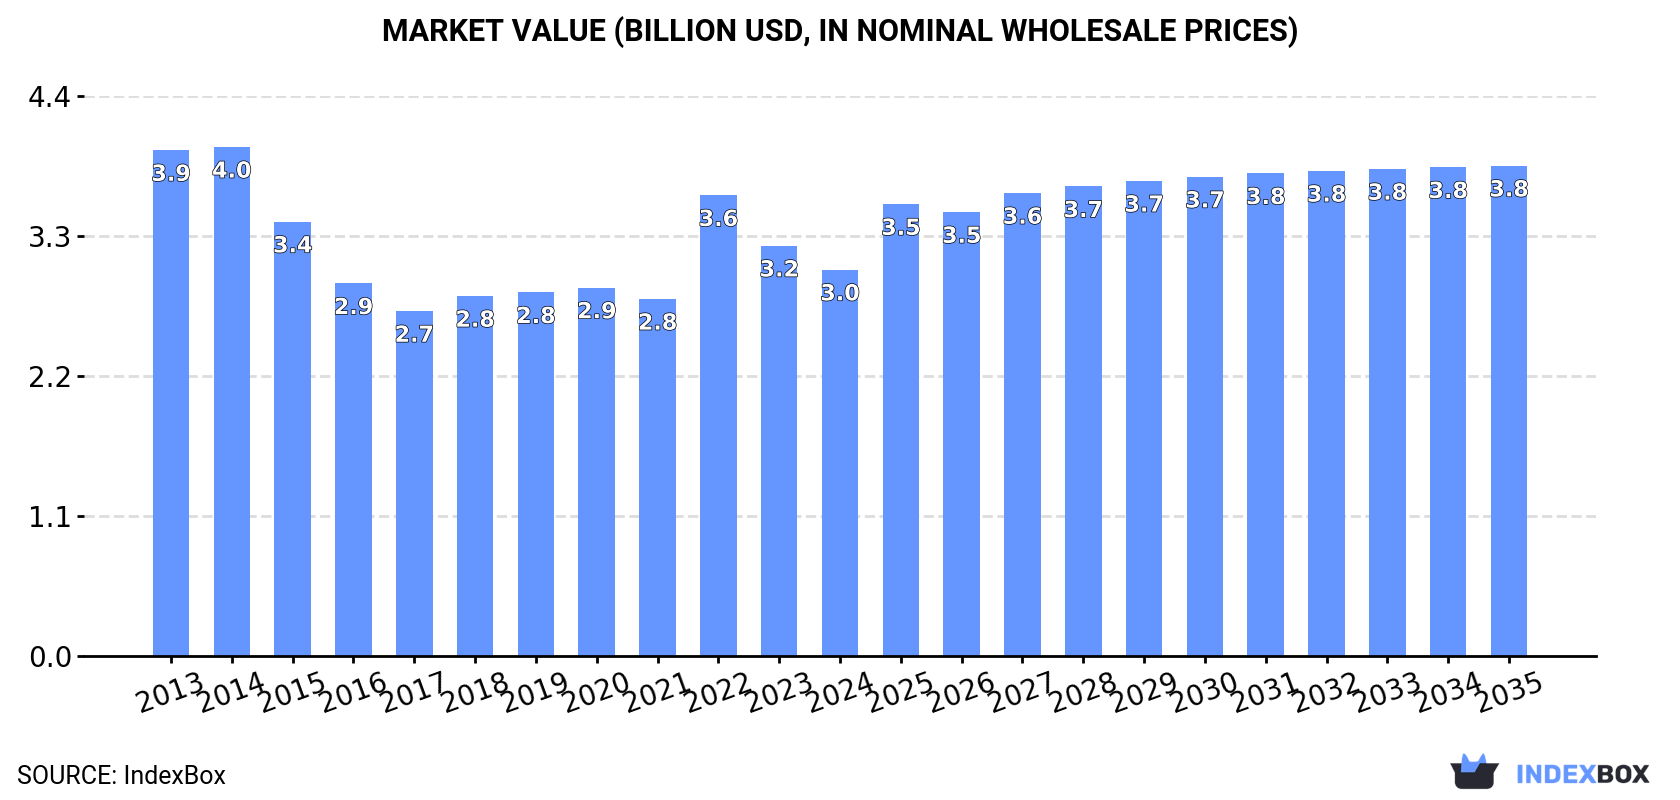
In value terms, the market is forecast to increase with an anticipated CAGR of +2.2% for the period from 2024 to 2035, which is projected to bring the market value to $3.8B (in nominal wholesale prices) by the end of 2035.
 ConsumptionUnited Kingdom’s Consumption of Graphic Papers
In 2024, graphic papers consumption in the UK stood at 2.2M tons, with an increase of 4.2% compared with the year before. Overall, consumption, however, continues to indicate a abrupt downturn. The most prominent rate of growth was recorded in 2022 when the consumption volume increased by 7.7%. Over the period under review, consumption attained the maximum volume at 4.5M tons in 2013; however, from 2014 to 2024, consumption stood at a somewhat lower figure.
The value of the graphic papers market in the UK declined to $3B in 2024, which is down by -5.8% against the previous year. This figure reflects the total revenues of producers and importers (excluding logistics costs, retail marketing costs, and retailers’ margins, which will be included in the final consumer price). Over the period under review, consumption, however, continues to indicate a pronounced shrinkage. Graphic papers consumption peaked at $4B in 2014; however, from 2015 to 2024, consumption failed to regain momentum.
Consumption By Type
Printing and writing paper (1.6M tons) constituted the product with the largest volume of consumption, accounting for 75% of total volume. Moreover, printing and writing paper exceeded the figures recorded for the second-largest type, newsprint (546K tons), threefold.
From 2013 to 2024, the average annual growth rate of the volume of printing and writing paper consumption amounted to -5.9%.
In value terms, printing and writing paper ($2.7B) led the market, alone. The second position in the ranking was held by newsprint ($354M).
From 2013 to 2024, the average annual rate of growth in terms of the value of printing and writing paper market stood at -1.4%.
ProductionUnited Kingdom’s Production of Graphic Papers
In 2024, production of graphic papers was finally on the rise to reach 929K tons for the first time since 2021, thus ending a two-year declining trend. Overall, production, however, recorded a deep contraction. The most prominent rate of growth was recorded in 2017 when the production volume increased by 13%. Graphic papers production peaked at 1.8M tons in 2013; however, from 2014 to 2024, production stood at a somewhat lower figure.
In value terms, graphic papers production fell modestly to $1.3B in 2024 estimated in export price. Over the period under review, production, however, recorded a perceptible downturn. The growth pace was the most rapid in 2017 with an increase of 36%. Graphic papers production peaked at $1.8B in 2013; however, from 2014 to 2024, production stood at a somewhat lower figure.
Production By Type
Newsprint (480K tons) and printing and writing paper (449K tons) were the main products of graphic papers production in the UK.
From 2013 to 2024, the most notable rate of growth in terms of production, amongst the leading produced products, was attained by printing and writing paper (with a CAGR of -2.1%).
In value terms, printing and writing paper ($1.3B) led the market, alone. The second position in the ranking was held by newsprint ($400M).
From 2013 to 2024, the average annual growth rate of the value of printing and writing paper production amounted to +3.5%.
ImportsUnited Kingdom’s Imports of Graphic Papers
Graphic papers imports into the UK amounted to 1.6M tons in 2024, picking up by 1.6% compared with 2023 figures. Overall, imports, however, continue to indicate a deep setback. The growth pace was the most rapid in 2022 when imports increased by 16% against the previous year. Over the period under review, imports hit record highs at 3.5M tons in 2015; however, from 2016 to 2024, imports failed to regain momentum.
In value terms, graphic papers imports reduced slightly to $1.9B in 2024. In general, imports, however, saw a perceptible reduction. The most prominent rate of growth was recorded in 2022 with an increase of 54% against the previous year. Over the period under review, imports reached the peak figure at $3.3B in 2014; however, from 2015 to 2024, imports failed to regain momentum.
Imports By Country
Germany (294K tons), Finland (272K tons) and Sweden (239K tons) were the main suppliers of graphic papers imports to the UK, with a combined 40% share of total imports. Norway, Austria, Portugal, Italy, Canada, Belgium, Brazil and France lagged somewhat behind, together comprising a further 45%.
From 2013 to 2022, the biggest increases were recorded for Canada (with a CAGR of +6.4%), while purchases for the other leaders experienced more modest paces of growth.
In value terms, Germany ($355M), Finland ($286M) and Sweden ($231M) constituted the largest graphic papers suppliers to the UK, with a combined 38% share of total imports. Austria, Portugal, Italy, Norway, Belgium, Canada, France and Brazil lagged somewhat behind, together accounting for a further 43%.
Among the main suppliers, Canada, with a CAGR of +8.8%, recorded the highest rates of growth with regard to the value of imports, over the period under review, while purchases for the other leaders experienced more modest paces of growth.
Imports By Type
In 2024, printing and writing paper (1.3M tons) constituted the largest type of graphic papers supplied to the UK, with a 80% share of total imports. Moreover, printing and writing paper exceeded the figures recorded for the second-largest type, newsprint (311K tons), fourfold.
From 2013 to 2024, the average annual growth rate of the volume of printing and writing paper imports totaled -7.3%.
In value terms, printing and writing paper ($1.6B) constituted the largest type of graphic papers supplied to the UK, comprising 89% of total imports. The second position in the ranking was held by newsprint ($205M), with an 11% share of total imports.
From 2013 to 2024, the average annual growth rate of the value of printing and writing paper imports stood at -5.0%.
Import Prices By Type
In 2024, the average graphic papers import price amounted to $1,177 per ton, shrinking by -4.5% against the previous year. Overall, import price indicated a pronounced increase from 2013 to 2024: its price increased at an average annual rate of +2.1% over the last eleven years. The trend pattern, however, indicated some noticeable fluctuations being recorded throughout the analyzed period. Based on 2024 figures, graphic papers import price increased by +48.6% against 2020 indices. The most prominent rate of growth was recorded in 2022 when the average import price increased by 33%. The import price peaked at $1,233 per ton in 2023, and then reduced slightly in the following year.
There were significant differences in the average prices amongst the major supplied products. In 2024, the product with the highest price was printing and writing paper ($1,305 per ton), while the price for newsprint stood at $661 per ton.
From 2013 to 2024, the most notable rate of growth in terms of prices was attained by printing and writing paper (+2.5%).
Import Prices By Country
The average graphic papers import price stood at $1,131 per ton in 2022, picking up by 33% against the previous year. Over the period from 2013 to 2022, it increased at an average annual rate of +2.1%. As a result, import price attained the peak level and is likely to continue growth in the immediate term.
There were significant differences in the average prices amongst the major supplying countries. In 2022, amid the top importers, the country with the highest price was France ($1,571 per ton), while the price for Norway ($760 per ton) was amongst the lowest.
From 2013 to 2022, the most notable rate of growth in terms of prices was attained by Portugal (+3.7%), while the prices for the other major suppliers experienced more modest paces of growth.
ExportsUnited Kingdom’s Exports of Graphic Papers
For the third consecutive year, the UK recorded decline in shipments abroad of graphic papers, which decreased by -10.7% to 344K tons in 2024. Overall, exports saw a deep contraction. The most prominent rate of growth was recorded in 2018 when exports increased by 7.7% against the previous year. The exports peaked at 737K tons in 2013; however, from 2014 to 2024, the exports stood at a somewhat lower figure.
In value terms, graphic papers exports contracted remarkably to $385M in 2024. In general, exports continue to indicate a abrupt shrinkage. The most prominent rate of growth was recorded in 2022 with an increase of 13%. The exports peaked at $870M in 2014; however, from 2015 to 2024, the exports stood at a somewhat lower figure.
Exports By Country
Germany (139K tons) was the main destination for graphic papers exports from the UK, accounting for a 35% share of total exports. Moreover, graphic papers exports to Germany exceeded the volume sent to the second major destination, France (45K tons), threefold. The United States (31K tons) ranked third in terms of total exports with a 7.8% share.
From 2013 to 2022, the average annual rate of growth in terms of volume to Germany amounted to +6.4%. Exports to the other major destinations recorded the following average annual rates of exports growth: France (-7.1% per year) and the United States (+3.0% per year).
In value terms, Germany ($159M) remains the key foreign market for graphic papers exports from the UK, comprising 26% of total exports. The second position in the ranking was held by France ($69M), with an 11% share of total exports. It was followed by the United States, with an 11% share.
From 2013 to 2022, the average annual growth rate of value to Germany totaled +5.7%. Exports to the other major destinations recorded the following average annual rates of exports growth: France (-3.3% per year) and the United States (+7.1% per year).
Exports By Type
Newsprint (245K tons) was the largest type of graphic papers exported from the UK, accounting for a 71% share of total exports. Moreover, newsprint exceeded the volume of the second product type, printing and writing paper (100K tons), twofold.
From 2013 to 2024, the average annual rate of growth in terms of the volume of newsprint exports stood at -3.9%.
In value terms, printing and writing paper ($210M) and newsprint ($174M) constituted the most exported types of graphic papers from the UK worldwide.
Among the main product categories, newsprint, with a CAGR of -2.5%, recorded the highest growth rate of the value of exports, over the period under review.
Export Prices By Type
The average graphic papers export price stood at $1,117 per ton in 2024, declining by -9.4% against the previous year. In general, the export price continues to indicate a relatively flat trend pattern. The most prominent rate of growth was recorded in 2022 when the average export price increased by 21% against the previous year. As a result, the export price reached the peak level of $1,526 per ton. From 2023 to 2024, the average export prices remained at a somewhat lower figure.
Prices varied noticeably by the product type; the product with the highest price was printing and writing paper ($2,114 per ton), while the average price for exports of newsprint stood at $712 per ton.
From 2013 to 2024, the most notable rate of growth in terms of prices was recorded for the following types: printing and writing paper (+2.0%).
Export Prices By Country
In 2022, the average graphic papers export price amounted to $1,526 per ton, surging by 21% against the previous year. Over the last nine-year period, it increased at an average annual rate of +3.3%. As a result, the export price reached the peak level and is likely to continue growth in the immediate term.
Prices varied noticeably by country of destination: amid the top suppliers, the country with the highest price was Malaysia ($3,329 per ton), while the average price for exports to Japan ($745 per ton) was amongst the lowest.
From 2013 to 2022, the most notable rate of growth in terms of prices was recorded for supplies to Malaysia (+20.7%), while the prices for the other major destinations experienced more modest paces of growth.