I saw this map for the first time recently and found it really fascinating. You might have fun trying to guess what it shows…
by double-happiness
I saw this map for the first time recently and found it really fascinating. You might have fun trying to guess what it shows…
by double-happiness
35 comments
I’m guessing annual mean wind speed (m s-1 ) at 45 metres above ground level by 1 km square or something like that
Number of sheep/coos compared to people
It’s the distribution of wild haggis throughout Scotland.
Windyness
How many Tunnock’s teacakes the average person eats at a time
Yes, I’ll take a shot in the dark and say *robot voice* “AI Overview
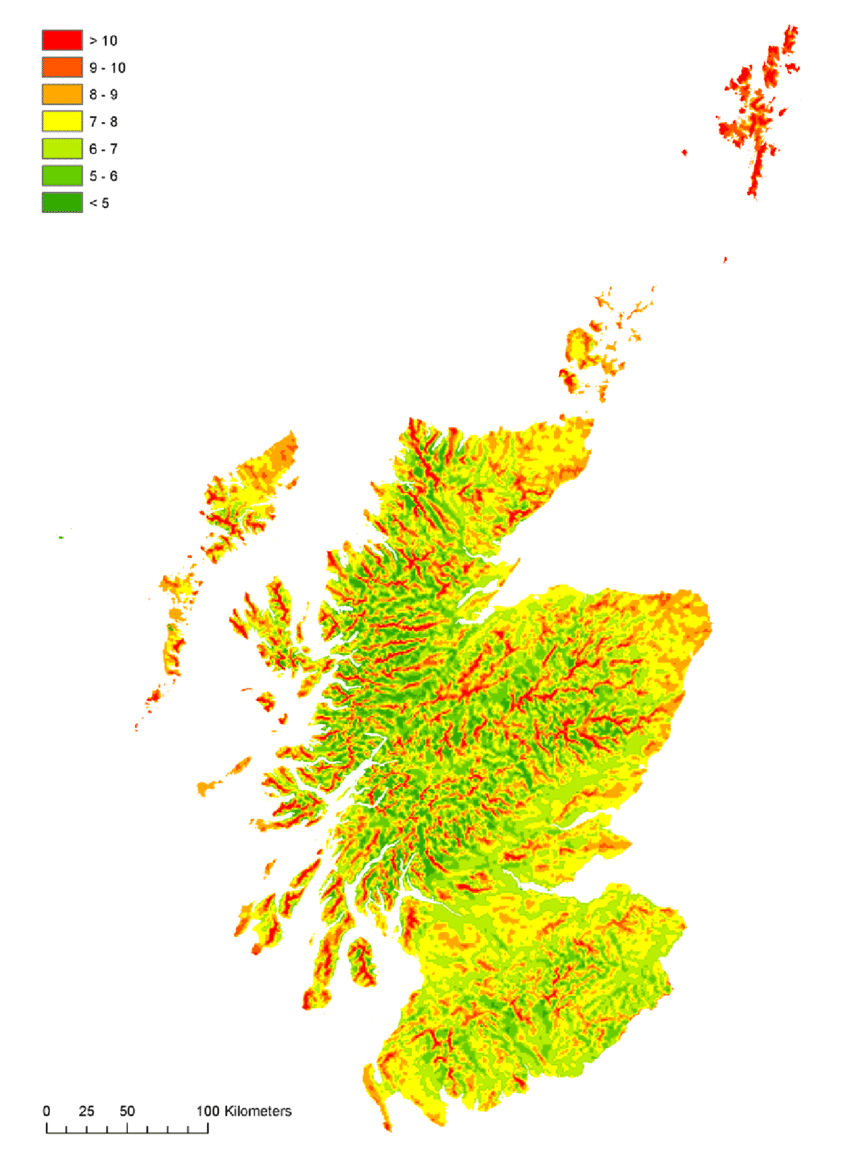
The image displays a map of Scotland illustrating annual mean wind speeds at 45 meters above ground level. The colors indicate wind speed intensity, with red representing the highest and yellow the lowest.
In general, Western Scotland experiences higher wind speeds compared to the rest of the country. The strongest winds in the UK are often recorded in mountainous areas, with a record gust of 173 mph recorded at Cairngorm Summit. The average wind speed in the UK was 4.27 m/s in 2023.
Wind speeds are typically measured at 10 meters above ground, but this map is based on measurements at 45 meters. The Beaufort Scale is used to relate wind speed to observable conditions on land or at sea.”
Or like, stabbings or something, I dunno.
Sales of wellies per capita.
Radon levels?
Bird sensitivities to wind farms.
Percentage of population whose best man was a border collie at their wedding?
Irn-Bru deposits
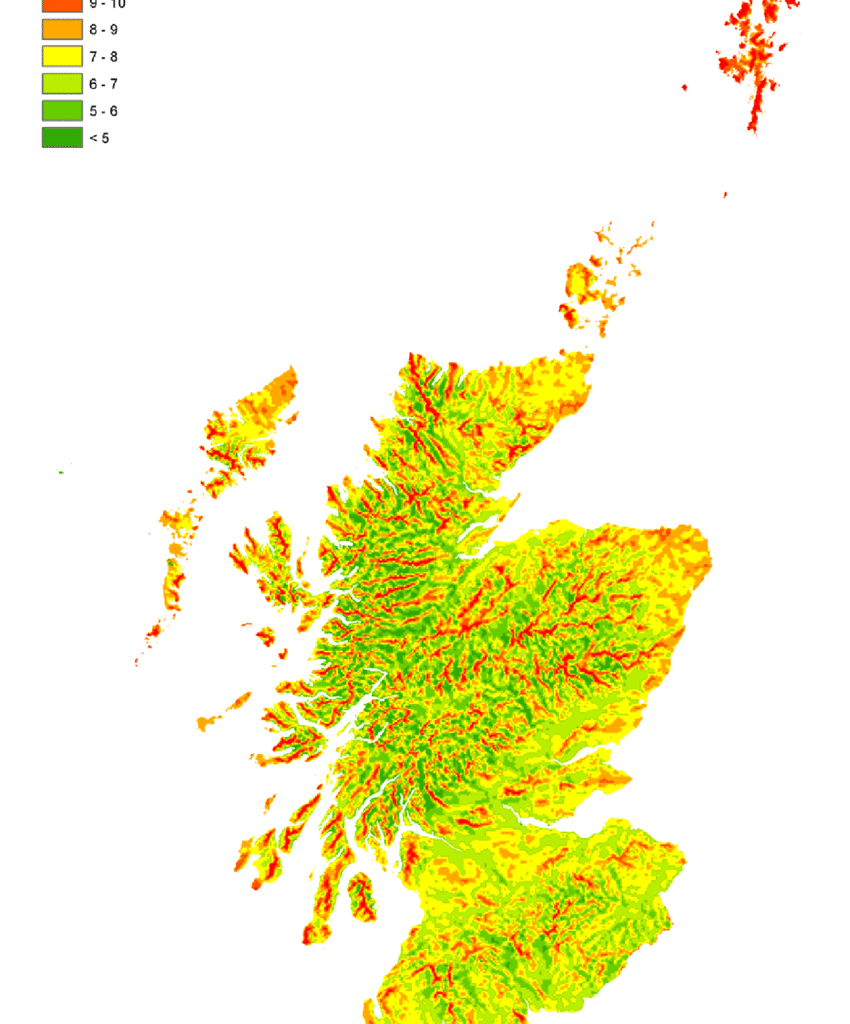
It’s a Map of Scotland showing annual mean wind speed (m s-1 ) at 45 metres above ground level by 1 km square.
Fucking Midges.
I know it’s not cause east coast has it easy streets but red/orange means danger and Midges are dangerous.
Amount of American’s claiming to be Willie Wallace’s great great grandchild. Once removed.
Blowyness-as-fuck
Distribution of some sort of plant like heather, bracken, moss or gorse?
Number lf Norwegians per 10 people.
Potential new Trump golf course locations.
likelihood to be murdered/be involved in investigating a murder
Price per-gram of weed?
Drug deaths
I know it’s wind: Wonder what the surce data is, must be extrapolated from the readings that are available/ forecast data/ terrain maps.
Haggis population densities?
average # of incidents of sheep buggery per week
Annual number of Haggis spotted in each area
Density of midgie population.
Great week for me in the wind industry, I’ve had two stand down days!
Buckfast mines.
Weasels per square mile.
Average hair colour?
Average distance from a tunnocks tea cake?
As a colour blind person, this is by far the worst thing I’ve ever seen.
I’ve seen this one before, I know exactly what it is. >! It shows the sensitivity of some bird species to wind farm development !< I don’t agree with the Map though, the correlation with elevation is too strong. IMO they’ve accidentally mapped viability for human settlement. Not many towns or cities are built on the slopes or tops of mountains. Really this just a map of where people are not rather showing any useful data.
Midgey concentrations?
Number of redheads per 10-people.
Comments are closed.