Data Monthly mean since 1659 https://www.metoffice.gov.uk/hadobs/hadcet/data/download.html
python code is here https://gist.github.com/cavedave/0a0f019b89671829bc60412ab3bb9548
Posted by cavedave
![Average UK Spring Temperature over Time [OC]](https://www.europesays.com/wp-content/uploads/2025/06/en5z1vd61a5f1-1920x1024.png)
Data Monthly mean since 1659 https://www.metoffice.gov.uk/hadobs/hadcet/data/download.html
python code is here https://gist.github.com/cavedave/0a0f019b89671829bc60412ab3bb9548
Posted by cavedave
4 comments
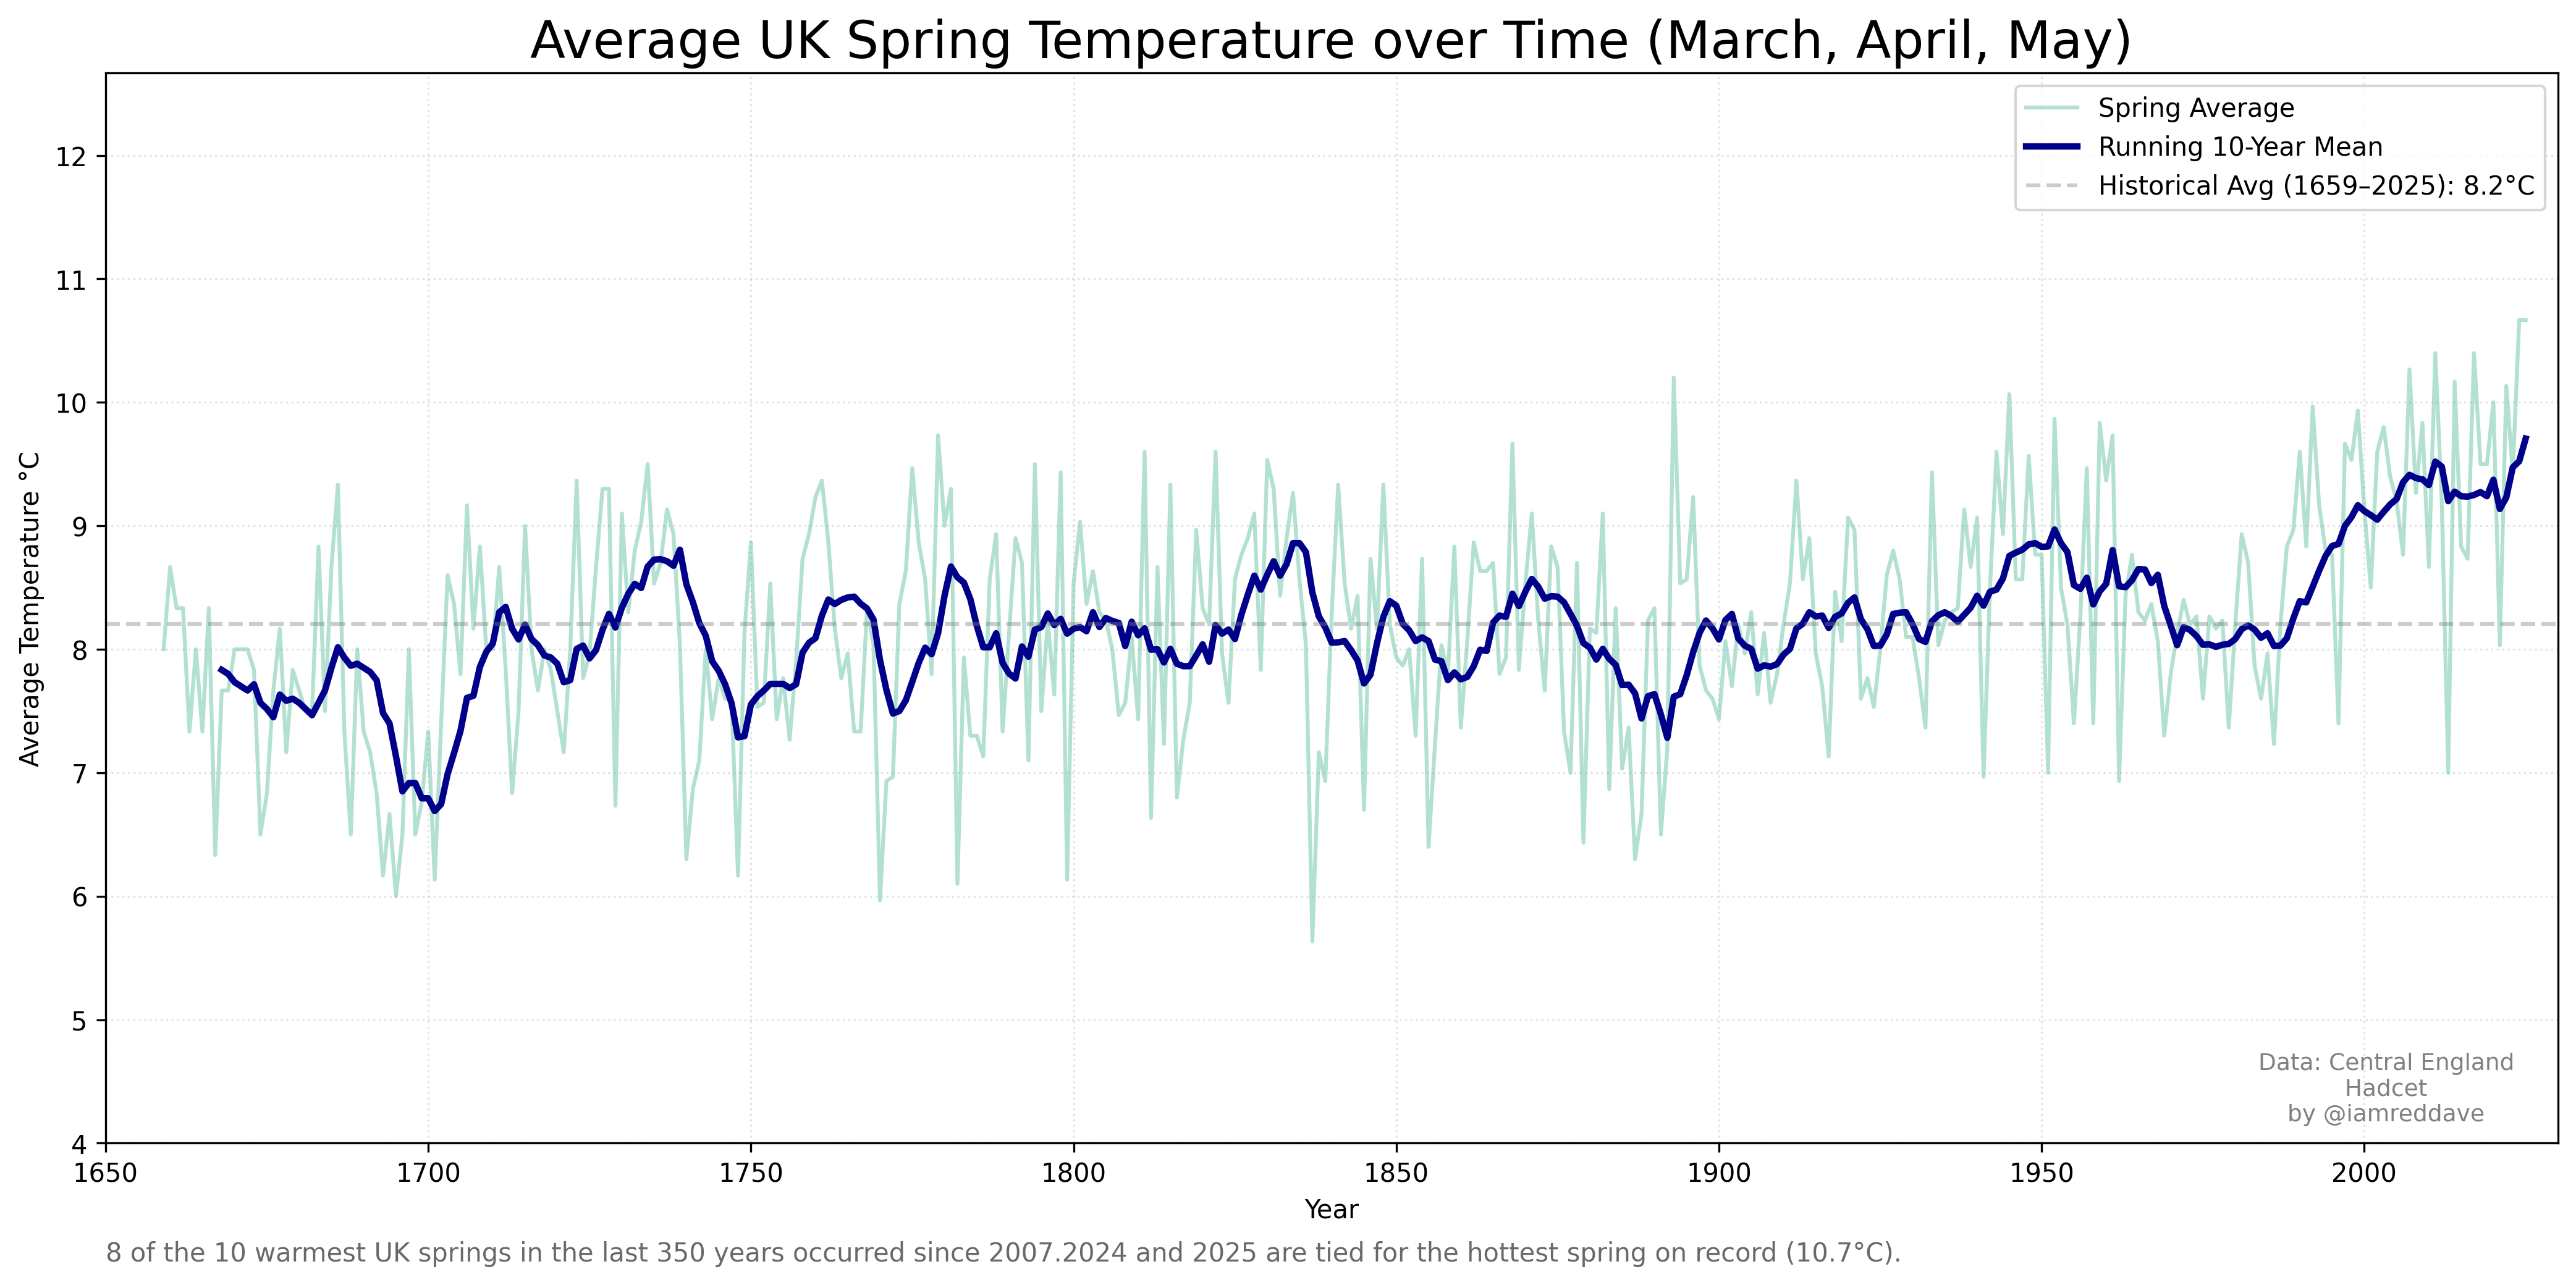
Warmest were
Year Mar Apr May Spring_Avg Running_10yr_Mean
2024 8.2 9.7 14.1 10.666667 9.523333
2025 7.9 10.9 13.2 10.666667 9.706667
2011 6.9 12.0 12.3 10.400000 9.520000
2017 8.8 9.1 13.3 10.400000 9.250000
2007 7.4 11.4 12.0 10.266667 9.413333
1893 7.2 10.3 13.1 10.200000 7.616667
2014 7.8 10.4 12.3 10.166667 9.276667
2022 8.0 9.3 13.1 10.133333 9.230000
1945 7.9 10.1 12.2 10.066667 8.756667
2020 6.8 10.6 12.6 10.000000 9.373333
1992 7.5 8.8 13.6 9.966667 8.506667
1999 7.3 9.6 12.9 9.933333 9.166667
data hadcet and python code linked to above
Also r/DataIsScary.
If this was Youtube the comments would be flooded with people claiming this is false, that measurements are results of urban island effects, or jet exhausts from airplanes because all weather stations are in airports right at the spot where planes fire up their engines for takeoff etc. It’s wild.
Very nice data and very clear trend. Sadly most politicians will continue to ignore it.
Nothing to see here
Comments are closed.