June 06, 2025
What Happens on Quarter-Ends in the Repo Market
Erik Bostrom, David Bowman, Amy Rose, and Andy Xia1
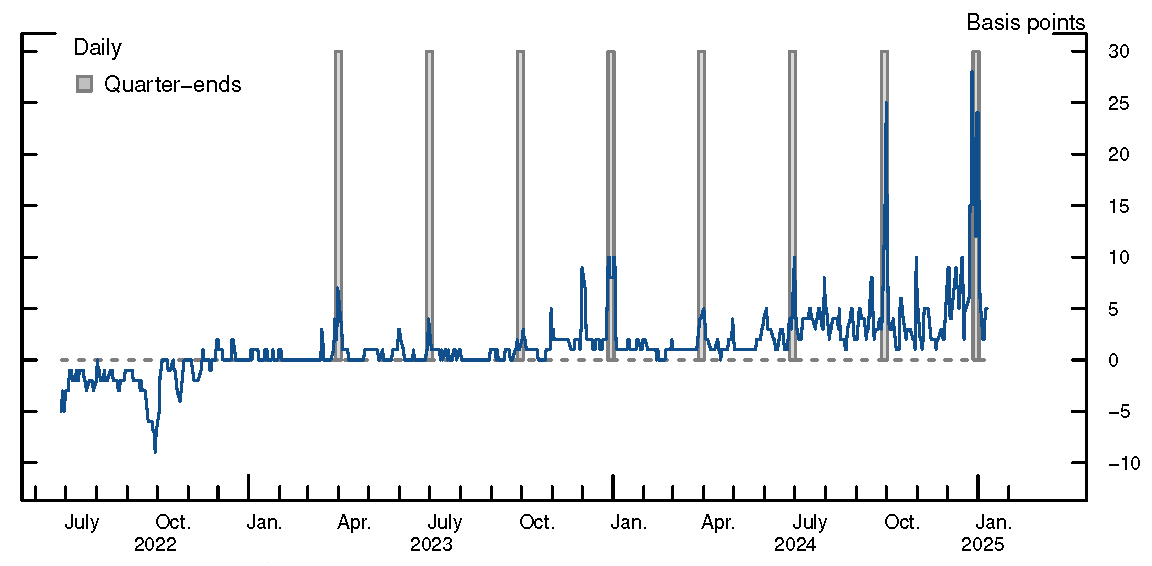
Over the course of the past two years, repo rates have begun to rise modestly around quarter-ends and, to a lesser extent, on some month-ends. As seen in Figure 1, after some time of the Secured Overnight Financing Rate (SOFR) remaining below or near the Overnight Reverse Repurchase (ON RRP) rate and with no or very little movement around quarter-ends, SOFR rose 7 basis points above the ON RRP rate at the end of March 2023, when banks’ demand for liquid assets increased following the collapse of Silicon Valley Bank, and has temporarily increased over each quarter-end since then. Last September and again at year end, the spread between SOFR and the ON RRP rate rose as much as 25 basis points, with SOFR surpassing the rate paid on reserves and a significant volume of repo trades occurring at even higher rates (not plotted).
These dynamics arise because some dealers scale back part of their repo intermediation on quarter- or month-ends, which can cause the spreads they charge to widen and the level of repo rates to increase. This behavior is not new: Dealers and other financial institutions often engage in what is known as window dressing by altering their behavior around financial reporting dates, which are typically quarter- or month-ends, in order to minimize the effects of a variety of regulatory or accounting rules. Because the jumps in spreads have been temporary, the dynamics that we are seeing currently have not been disruptive to the market or particularly costly to repo borrowers. However, based on past experience, the behavior of repo rates around quarter- or month-ends may intensify over time as the Federal Reserve’s balance sheet normalization continues and reserves become less abundant. The remainder of this note describes some of the dynamics underlying repo markets around quarter-ends and argues that the increase in rates at these times is a potential measure of the degree of tightness in the repo market. As such, the behavior of repo rates on these dates may represent another indicator that will be useful to monitor as balance sheet normalization continues.
The dynamics we have been seeing in repo rates represent a reemergence of a pattern that occurred regularly prior to the COVID-19 pandemic. As seen in Figure 2, over 2017, SOFR regularly rose 5 to 10 basis points relative to the ON RRP rate around month-ends. As the figure shows, the jumps in rates around quarter- and month-ends have tended to move in line with the overall levels of repo rate spreads outside of quarter- and month-ends. These jumps began to grow noticeably larger in late 2018 through September 2019 before diminishing as the Federal Reserve injected reserves in response to the repo-market pressures that occurred in September and as it expanded its balance sheet significantly in 2020 in response to the pandemic, further increasing reserves.2
The changes in dealer behavior around quarter-ends are consistent with efforts to reduce their reported balance sheet size, with certain dealers reducing their activity in some segments of the repo market and others shifting activity into central clearing to increase netting opportunities. These changes are associated with a higher spread earned on repo intermediation and higher repo rates. Figure 3 presents some further detail on how dealers’ behaviors tend to change around quarter ends. As seen in the top-left panel (panel A), borrowing in the triparty repo market has tended to decline at the end of the quarter (date 0 in the charts). This decline in triparty repo borrowing is mostly driven by a decline in borrowing by a few large foreign dealers. As dealers reduce their borrowing in triparty repo, money market funds and other entities that are active lenders in this segment also shift some of their lending to the centrally cleared sponsored repo market (panel B). The larger U.S. custody banks and some other firms that have actively pursued sponsoring agreements tend to increase their sponsored repo borrowing from money funds. These custody banks then lend much of the funds they receive in the interdealer market, which partially offsets some of the effects from the pullback in triparty activity, although the rates they lend at in the interdealer market are higher than the rates in triparty. In addition, a range of both foreign and domestic dealers increase their sponsored reverse repo lending, likely moving a portion of their noncentrally cleared repo lending to hedge funds and other clients into central clearing in order to increase their balance sheet netting. Money market funds and other entities that are active lenders in triparty repo also shift some of their lending into the Federal Reserve’s ON RRP facility (panel C). 3
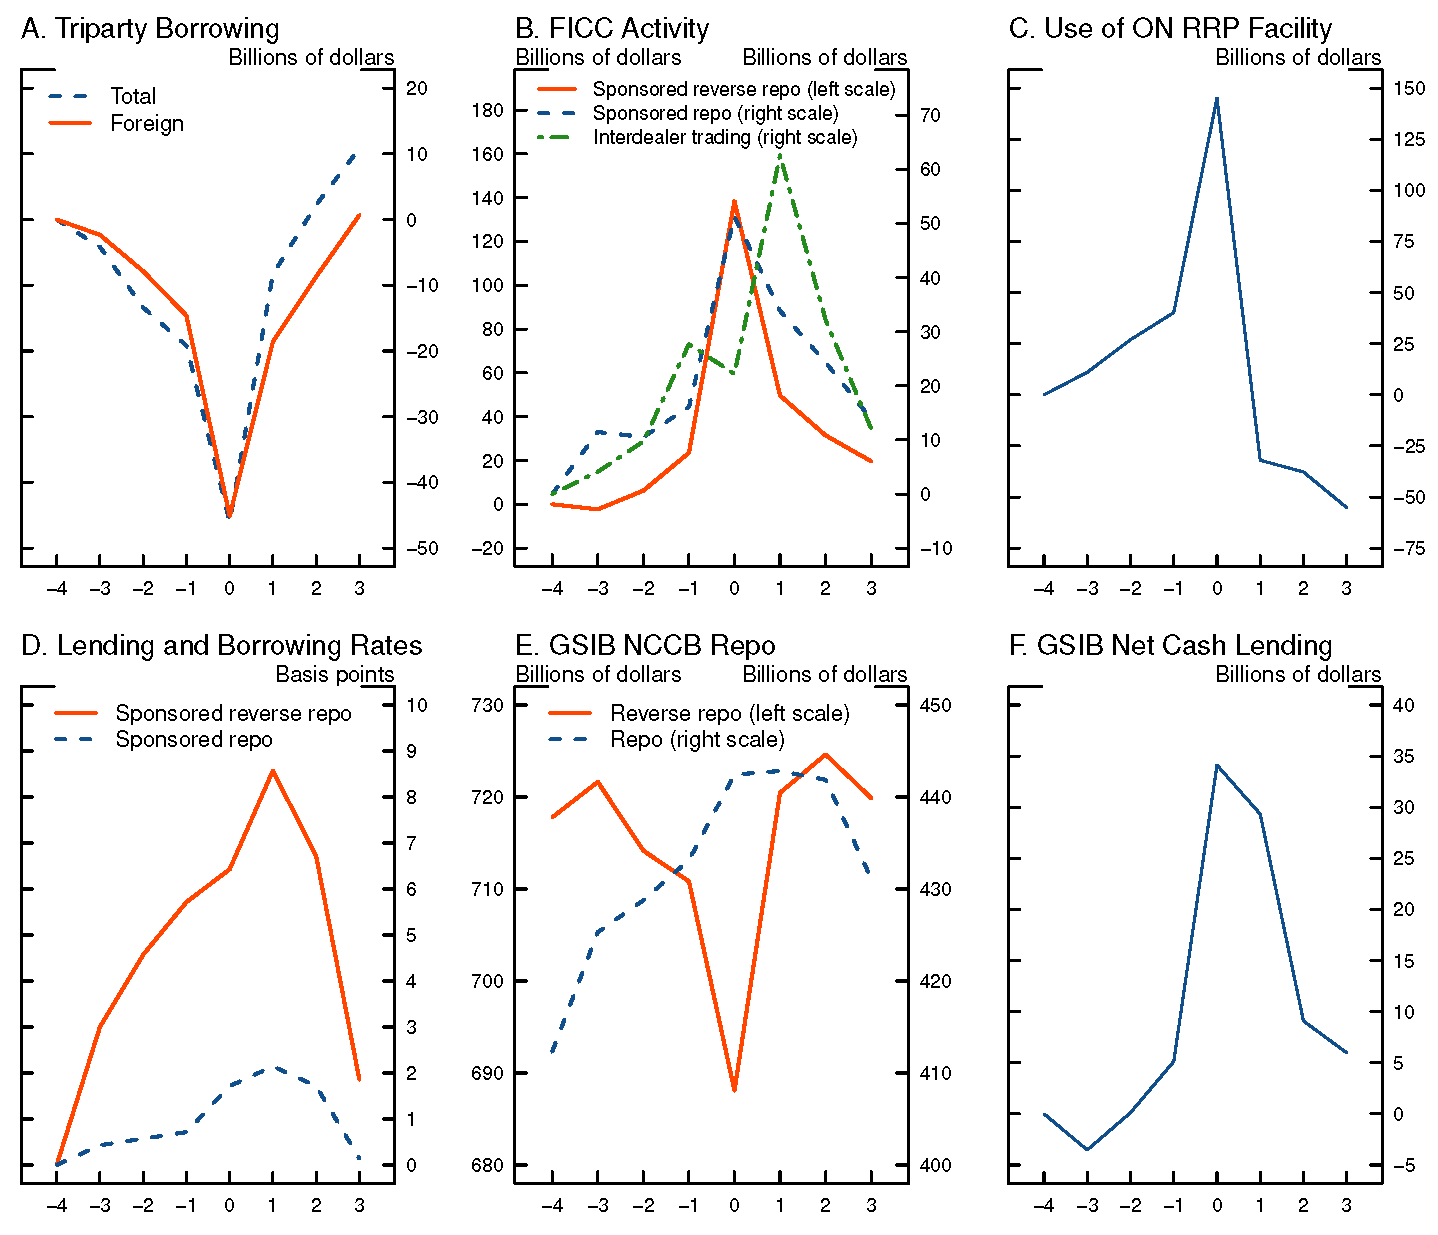
The pullback in repo activity by some dealers is reflected in a higher cost of intermediation and a higher level of repo rates. As seen in panel D, the spread between the rates that dealers earn by lending and the rate they pay to borrow in the sponsored repo market tends to increase around quarter-ends. Using the methodology described in Bowman, Huh, and Infante (2024) we can also derive estimates of GSIB activity in the noncentrally cleared bilateral (NCCB) segment of the repo market. As shown in panel E, the GSIBs have tended to reduce their reverse repo (cash lending) while tending to increase their repo (cash borrowing) over recent quarter-ends. Because these firms conduct more reverse repo than repo activity in the NCCB segment, these shifts in behavior likely have the impact of increasing the amount of netting that the GSIBs are able to achieve, reducing the overall size of their balance sheets. In addition, the rise in rates also appears to induce these firms to lend more of their own cash into the repo market (panel F).
Some have pointed to the supplementary leverage ratio (SLR) as potentially motivating window dressing in the repo market because European banks calculate their SLR ratios based on positions at the end of each quarter rather than on quarterly averages as in the U.S. However, window dressing behavior in the triparty repo market and in other markets, such as the federal funds market, appears to predate the SLR, and the fact that we also see similar types of behavior around many month-ends point to other considerations. It may be likely that there are a range of regulatory considerations that lead to window dressing behavior, with different dealers reacting to different considerations.
Whatever the underlying factors behind window dressing in repo markets, they do not change frequently, and the basic patterns of shifts in dealer activity shown in Figure 3 appear to be fairly regular over time. For example, the size of declines in triparty borrowing by foreign banks around quarter-ends has been remarkably stable over the past three years (Figure 4), even as the quarter-end effects on repo rates have grown as the Federal Reserve’s balance sheet normalization progressed. Thus, the increase in the magnitude of the jumps in rates appears to have been tied to growing tightness in the repo market and a diminishing elasticity of supply and demand.
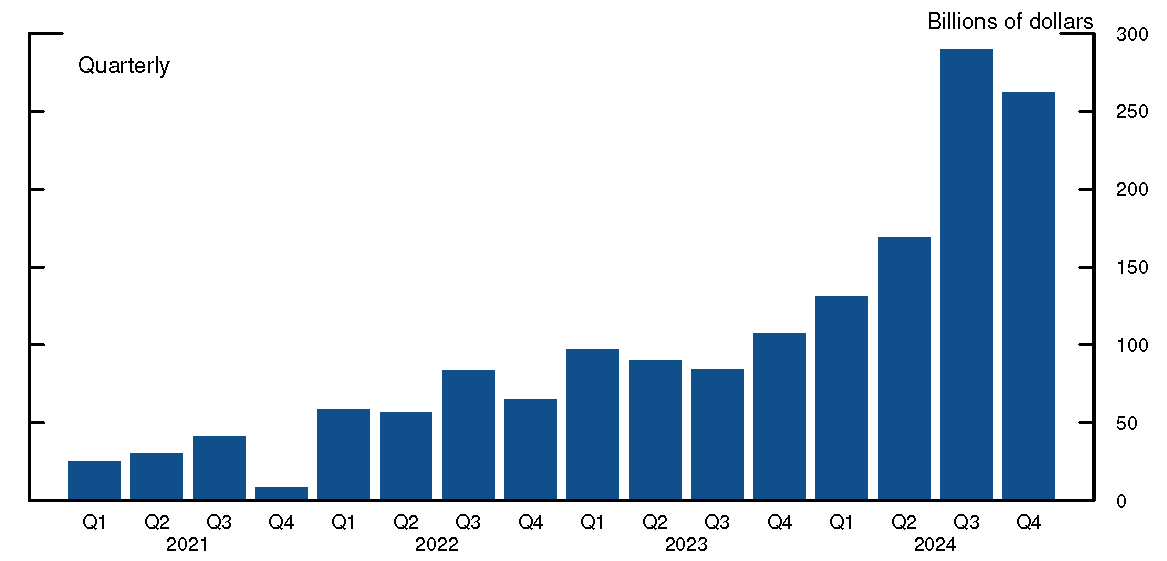
One area where we do see a trend over time is the amount of increase in sponsored lending that has occurred on quarter ends. As seen in Figure 5, the increase in sponsored lending around quarter-ends has progressively grown, exceeding $250 billion over the two most recent quarters. This increase in sponsored lending can, of its own, increase the move in SOFR on quarter ends because these trades tend to take place at higher rates (as seen in panel 3.D) and are included in SOFR. To gauge the extent of this potential impact, we calculated an estimate of what SOFR would have been had sponsored lending held constant at each recent quarter end, assuming that sponsored rates increased as observed but holding the (hypothetical) level of sponsored lending at the average between level observed days T-7 and T-3 prior to each quarter date T. Overall, while this composition effect can explain some of the increase in SOFR, it does not explain most of the movement we see in rates. For example, over the December 2024 quarter end, we estimate the impact to be 2 basis points.
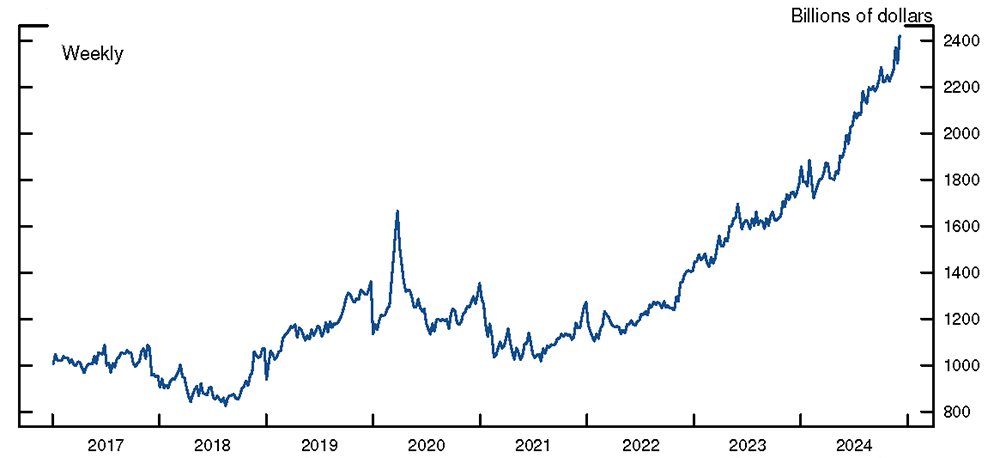
The increase in the effect on rates during the previous 2018-19 episode and in the current one is likely tied to the trend increase in demand for repo borrowing. Figure 6 shows a measure of this financing activity, aggregating NCCB cash lending by the Primary Dealers and sponsored cash lending through FICC.4 Cash lending in both segments is directed primarily to hedge funds. As shown, this measure of repo financing rose notably over 2018-19 and has increased even more sharply recently, more than doubling over the last two years.
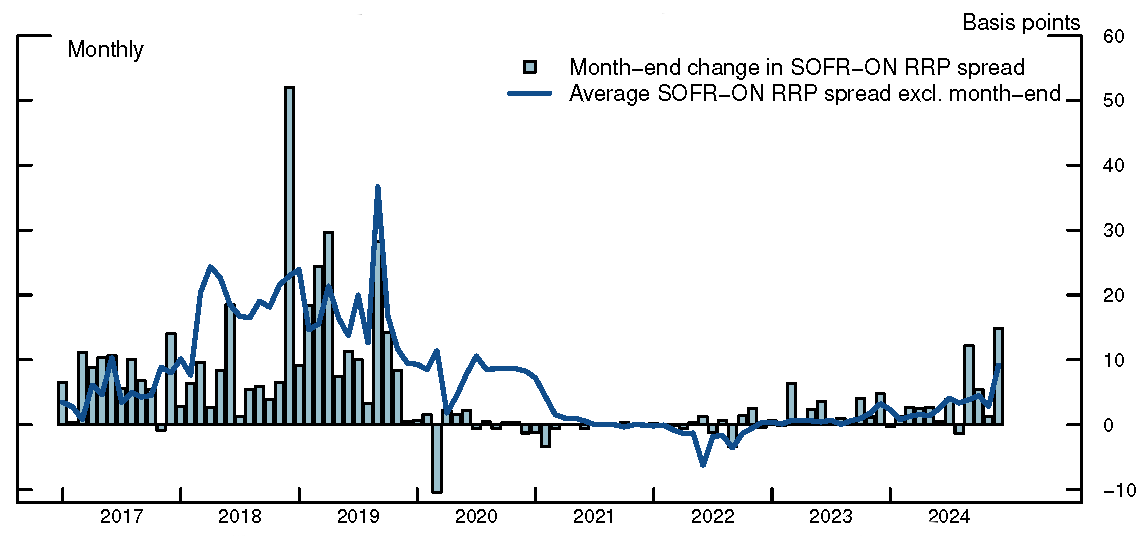
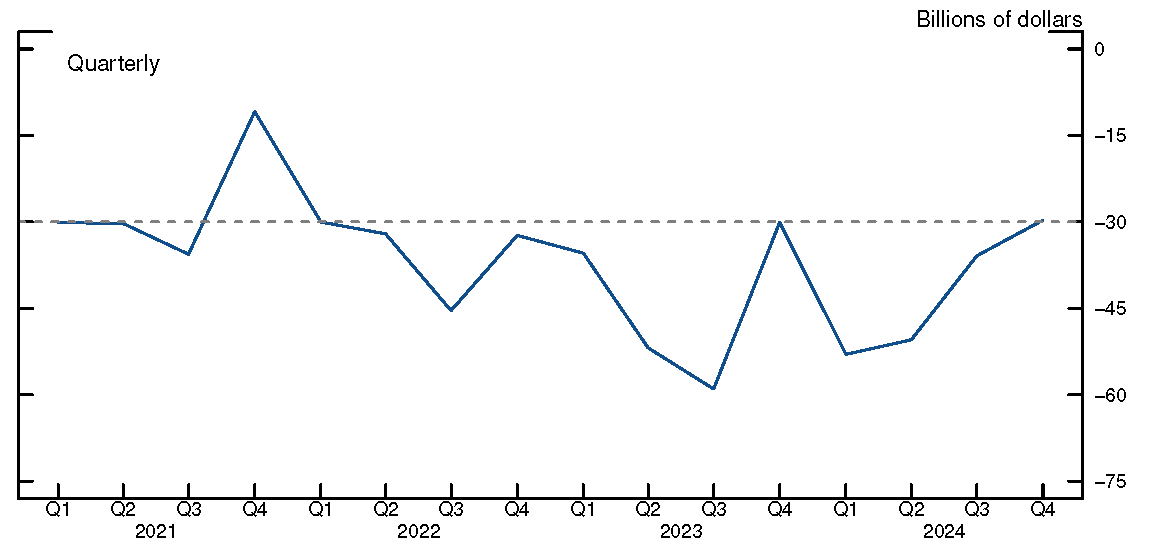
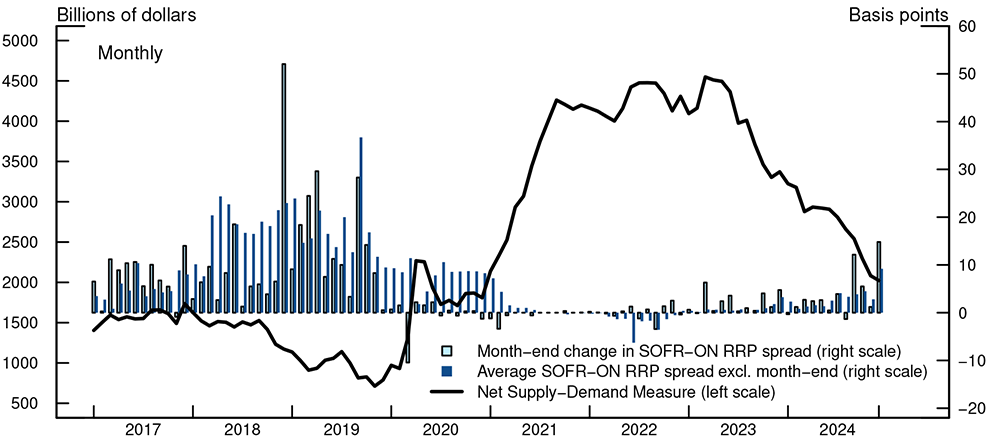
In order to explore this connection a bit further, we compare this measure of financing demand to a corresponding measure of the supply of funding sources available to lend into the repo market, in which we include (i) reserves held by large domestic and foreign banking organizations (the firms most likely to be affiliated with dealers active in lending in the repo market), (ii) cash borrowed by the Primary Dealers in triparty repo and sponsored borrowing through FICC, and (iii) funds held in the ON RRP. The resulting measure of net supply-demand is shown in Figure 7, along with month-end changes in the spread of SOFR to the ON RRP rate and the average spread excluding month-ends. As can be seen, both month-end changes and the average spread increased over this period as this measure of net supply declined, and then quickly diminished with the expansion of the Federal Reserve’s balance sheet, which increased the net supply measure substantially as there were fewer Treasury securities held by the public in need of financing and a higher level of liquidity that could be used to fund repo lending. These rate effects have begun to reemerge with continued significant Treasury issuance and associated demand for repo financing and as the Federal Reserve’s balance sheet has declined, leading to a sharp decline in our net supply measure since mid-2023.
Going forward, as Treasury issuance continues to increase and as reserves and the ON RRP decline, the repo market is likely to tighten further and the effects of quarter- or month-ends on repo rates may grow, providing another potential indicator that reserves are becoming less abundant.
References
Bowman, David, Yesol Huh, and Sebastian Infante (2024), Balance-Sheet Netting in U.S. Treasury Markets and Central Clearing, Finance and Economic Discussion Series 2024-057. Washington: Board of Governors of the Federal Reserve System.
Cordes, Lucy and Sebastian Infante (2025), Repo Rate Sensitivity to Treasury Issuance and Quantitative Tightening, FEDS Notes. Washington: Board of Governors of the Federal Reserve System, February 12, 2025.
Bostrom, Erik, David Bowman, Amy Rose, and Andy Xia (2025). “What Happens on Quarter-Ends in the Repo Market,” FEDS Notes. Washington: Board of Governors of the Federal Reserve System, June 06, 2025, https://doi.org/10.17016/2380-7172.3787.