Jun 9, 2025
IndexBox has just published a new report: EU – Quartz Crystal (Natural) – Market Analysis, Forecast, Size, Trends And Insights.
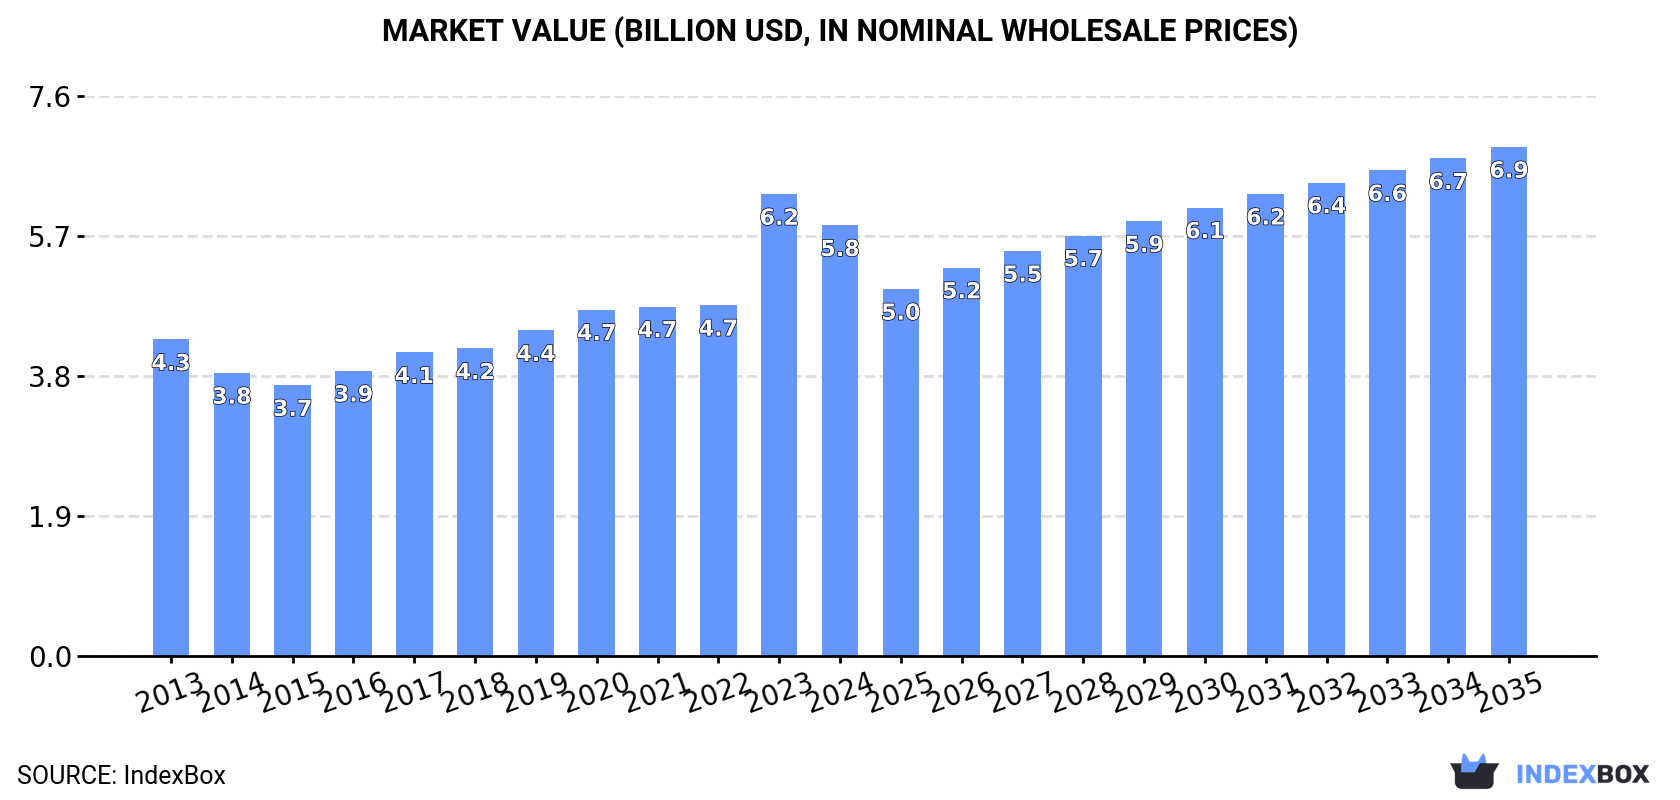
The demand for natural quartz crystal in the European Union is on the rise, leading to an expected upward consumption trend over the next decade. The market performance is forecasted to increase slightly, with a projected market volume of 46M tons and a market value of $6.9B by the end of 2035. Anticipated CAGR of +0.3% for volume and +1.5% for value for the period from 2024 to 2035.
Market Forecast
Driven by rising demand for natural quartz crystal in the European Union, the market is expected to start an upward consumption trend over the next decade. The performance of the market is forecast to increase slightly, with an anticipated CAGR of +0.3% for the period from 2024 to 2035, which is projected to bring the market volume to 46M tons by the end of 2035.
In value terms, the market is forecast to increase with an anticipated CAGR of +1.5% for the period from 2024 to 2035, which is projected to bring the market value to $6.9B (in nominal wholesale prices) by the end of 2035.
 ConsumptionEuropean Union’s Consumption of Quartz Crystal (Natural)
In 2024, consumption of quartz crystal (natural) decreased by -0.6% to 45M tons, falling for the fourth consecutive year after three years of growth. In general, consumption continues to indicate a relatively flat trend pattern. The growth pace was the most rapid in 2018 when the consumption volume increased by 2.5%. Over the period under review, consumption hit record highs at 47M tons in 2013; however, from 2014 to 2024, consumption remained at a lower figure.
The revenue of the natural quartz crystal market in the European Union fell to $5.8B in 2024, waning by -6.8% against the previous year. This figure reflects the total revenues of producers and importers (excluding logistics costs, retail marketing costs, and retailers’ margins, which will be included in the final consumer price). The total consumption indicated notable growth from 2013 to 2024: its value increased at an average annual rate of +2.8% over the last eleven years. The trend pattern, however, indicated some noticeable fluctuations being recorded throughout the analyzed period. Based on 2024 figures, consumption increased by +59.0% against 2015 indices. As a result, consumption attained the peak level of $6.2B, and then dropped in the following year.
Consumption By Country
The countries with the highest volumes of consumption in 2024 were Germany (12M tons), France (9M tons) and Italy (6.8M tons), with a combined 62% share of total consumption. Spain, the Netherlands, Portugal and Belgium lagged somewhat behind, together comprising a further 26%.
From 2013 to 2024, the most notable rate of growth in terms of consumption, amongst the main consuming countries, was attained by Portugal (with a CAGR of +0.4%), while consumption for the other leaders experienced mixed trends in the consumption figures.
In value terms, the largest natural quartz crystal markets in the European Union were Germany ($1.5B), France ($1.1B) and Italy ($879M), together accounting for 60% of the total market. Belgium, Spain, the Netherlands and Portugal lagged somewhat behind, together comprising a further 27%.
In terms of the main consuming countries, Portugal, with a CAGR of +7.7%, recorded the highest growth rate of market size over the period under review, while market for the other leaders experienced more modest paces of growth.
The countries with the highest levels of natural quartz crystal per capita consumption in 2024 were Portugal (160 kg per person), the Netherlands (152 kg per person) and Germany (143 kg per person).
From 2013 to 2024, the most notable rate of growth in terms of consumption, amongst the main consuming countries, was attained by Portugal (with a CAGR of +0.7%), while consumption for the other leaders experienced a decline in the per capita consumption figures.
ProductionEuropean Union’s Production of Quartz Crystal (Natural)
In 2024, production of quartz crystal (natural) decreased by -1% to 45M tons, falling for the third consecutive year after four years of growth. Over the period under review, production continues to indicate a relatively flat trend pattern. The growth pace was the most rapid in 2018 with an increase of 2.3%. Over the period under review, production reached the peak volume at 48M tons in 2021; however, from 2022 to 2024, production remained at a lower figure.
In value terms, natural quartz crystal production fell to $6.6B in 2024 estimated in export price. The total production indicated a noticeable increase from 2013 to 2024: its value increased at an average annual rate of +4.3% over the last eleven-year period. The trend pattern, however, indicated some noticeable fluctuations being recorded throughout the analyzed period. Based on 2024 figures, production increased by +91.9% against 2015 indices. The most prominent rate of growth was recorded in 2023 with an increase of 44%. As a result, production attained the peak level of $7.2B, and then fell in the following year.
Production By Country
The countries with the highest volumes of production in 2024 were Germany (12M tons), France (9M tons) and Italy (6.7M tons), with a combined 61% share of total production. Spain, the Netherlands, Portugal and Belgium lagged somewhat behind, together accounting for a further 26%.
From 2013 to 2024, the most notable rate of growth in terms of production, amongst the key producing countries, was attained by Portugal (with a CAGR of +0.6%), while production for the other leaders experienced mixed trends in the production figures.
ImportsEuropean Union’s Imports of Quartz Crystal (Natural)
In 2024, overseas purchases of quartz crystal (natural) decreased by -14.6% to 581K tons, falling for the third consecutive year after two years of growth. Overall, imports saw a pronounced descent. The most prominent rate of growth was recorded in 2021 when imports increased by 31% against the previous year. As a result, imports reached the peak of 1.2M tons. From 2022 to 2024, the growth of imports failed to regain momentum.
In value terms, natural quartz crystal imports amounted to $193M in 2024. Total imports indicated perceptible growth from 2013 to 2024: its value increased at an average annual rate of +4.1% over the last eleven-year period. The trend pattern, however, indicated some noticeable fluctuations being recorded throughout the analyzed period. The pace of growth was the most pronounced in 2021 when imports increased by 49% against the previous year. The level of import peaked in 2024 and is likely to see steady growth in years to come.
Imports By Country
The purchases of the five major importers of quartz crystal (natural), namely Sweden, France, Italy, Germany and Poland, represented more than two-thirds of total import. It was distantly followed by Spain (36K tons), mixing up a 6.2% share of total imports. Belgium (16K tons) followed a long way behind the leaders.
From 2013 to 2024, the most notable rate of growth in terms of purchases, amongst the leading importing countries, was attained by France (with a CAGR of +4.7%), while imports for the other leaders experienced more modest paces of growth.
In value terms, Italy ($65M), Germany ($37M) and France ($11M) constituted the countries with the highest levels of imports in 2024, together comprising 59% of total imports.
In terms of the main importing countries, Italy, with a CAGR of +9.9%, saw the highest growth rate of the value of imports, over the period under review, while purchases for the other leaders experienced more modest paces of growth.
Import Prices By Country
The import price in the European Union stood at $332 per ton in 2024, growing by 30% against the previous year. Over the period under review, the import price posted a strong increase. The pace of growth appeared the most rapid in 2022 when the import price increased by 31% against the previous year. The level of import peaked in 2024 and is expected to retain growth in the immediate term.
Prices varied noticeably by country of destination: amid the top importers, the country with the highest price was Italy ($711 per ton), while Poland ($41 per ton) was amongst the lowest.
From 2013 to 2024, the most notable rate of growth in terms of prices was attained by Germany (+11.9%), while the other leaders experienced more modest paces of growth.
ExportsEuropean Union’s Exports of Quartz Crystal (Natural)
For the third consecutive year, the European Union recorded decline in overseas shipments of quartz crystal (natural), which decreased by -21.1% to 1M tons in 2024. Overall, exports saw a relatively flat trend pattern. The most prominent rate of growth was recorded in 2021 when exports increased by 60% against the previous year. As a result, the exports reached the peak of 1.7M tons. From 2022 to 2024, the growth of the exports remained at a lower figure.
In value terms, natural quartz crystal exports fell to $163M in 2024. In general, exports, however, enjoyed a remarkable increase. The pace of growth was the most pronounced in 2021 with an increase of 54%. The level of export peaked at $168M in 2023, and then shrank slightly in the following year.
Exports By Country
In 2024, Spain (438K tons), distantly followed by Germany (287K tons) and France (126K tons) were the major exporters of quartz crystal (natural), together constituting 84% of total exports. Greece (37K tons), Poland (36K tons), Portugal (32K tons) and Italy (24K tons) took a minor share of total exports.
From 2013 to 2024, the most notable rate of growth in terms of shipments, amongst the leading exporting countries, was attained by Greece (with a CAGR of +73.4%), while the other leaders experienced more modest paces of growth.
In value terms, Spain ($39M), Italy ($38M) and Germany ($23M) appeared to be the countries with the highest levels of exports in 2024, with a combined 61% share of total exports. France, Portugal, Poland and Greece lagged somewhat behind, together accounting for a further 13%.
Among the main exporting countries, Greece, with a CAGR of +50.6%, saw the highest growth rate of the value of exports, over the period under review, while shipments for the other leaders experienced more modest paces of growth.
Export Prices By Country
In 2024, the export price in the European Union amounted to $161 per ton, rising by 23% against the previous year. Overall, the export price recorded strong growth. The pace of growth appeared the most rapid in 2023 an increase of 63%. Over the period under review, the export prices reached the maximum in 2024 and is expected to retain growth in the immediate term.
Prices varied noticeably by country of origin: amid the top suppliers, the country with the highest price was Italy ($1,590 per ton), while Greece ($42 per ton) was amongst the lowest.
From 2013 to 2024, the most notable rate of growth in terms of prices was attained by Italy (+15.7%), while the other leaders experienced more modest paces of growth.