
Key Highlights
WTI Crude Oil prices started a decent increase above the $62.50 level.
A key bullish trend line is forming with support at $64.20 on the 4-hour chart.
Gold prices are facing hurdles near the $3,400 resistance.
EUR/USD is consolidating and might aim for a move above the 1.1440 resistance zone.
WTI Crude Oil Price Technical Analysis
WTI Crude Oil price found support at $61.50 and recovered against the US Dollar. There was a move above the $62.00 and $62.50 resistance levels.
Looking at the 4-hour chart of XTI/USD, the price settled above the $63.20 level, the 100 simple moving average (red, 4-hour), and the 200 simple moving average (green, 4-hour).
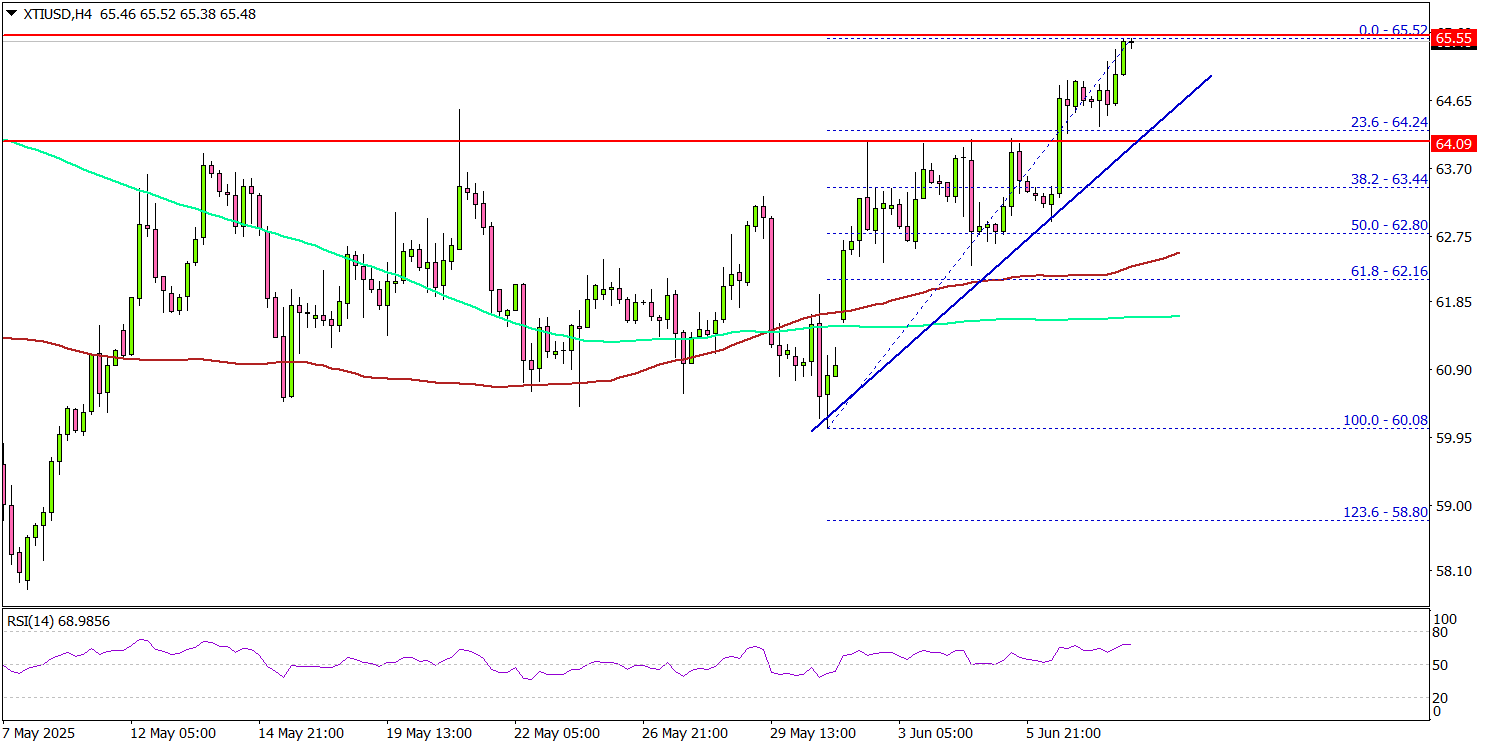
The bulls even pushed the price above $65.00 before the bears appeared. The current price action suggests that the price might rise further above the $65.50 resistance. The first key resistance sits near the $66.20 level.
The main hurdle is now near the $68.00 zone, above which the price may perhaps accelerate higher. In the stated case, it could even visit the $70.00 resistance. Any more gains might call for a test of the $72.00 resistance zone in the near term.
On the downside, the first major support sits near the $64.20 zone. There is also a key bullish trend line forming with support at $64.20 on the same chart.
A daily close below $64.20 could open the doors for a larger decline. The next major support is $62.50 and the 100 simple moving average (red, 4-hour). Any more losses might send oil prices toward $60.00 in the coming days.
Looking at Gold, there was a fresh increase above $3,350, but the bears might remain active near the $3,400 level.
Economic Releases to Watch Today
UK Claimant Count Change for May 2025 – Forecast 9.5K, versus 5.2K previous.
UK ILO Unemployment Rate for April 2025 (3M) – Forecast 4.6%, versus 4.5% previous.