This study included 5153 patients treated on clinical trials at Dana-Farber Cancer Institute (DFCI). The median age at the time of trial enrollment was 60 (interquartile range: 52–67). Approximately 3133 (60.8%) were female. Most of the patients were white (90.2%, n = 4653), followed by Asian (2.9%, n = 149), and black (2.8%, n = 145). The most common cancer types represented were breast cancer (n = 1006; 19.5%); lung cancer (n = 573; 11.1%); and ovarian cancer (n = 539; 10.5%). The detailed distribution of different cancers is outlined in Supplementary Table 1. The full cohort had 99,318 radiological reports with manually curated RECIST labels at a total of 38,727 timepoints (Table 1). On a per-timepoint basis in the validation set, the prevalence of overall response and progressive disease was 36% and 21%, respectively. Within the held-out test set, the prevalence of overall response and progressive disease was 33% and 21%, respectively.
Distillation dataset alignment
The Medical Information Mart for Intensive Care-IV (MIMIC-IV) and generative pre-trained transformer-4-turbo (GPT-4) synthetic datasets showed strong semantic alignment with the original PHI containing DFCI dataset (mean of max cosine similarities: 0.794 and 0.809, respectively). As expected, Wiki-text had lower semantic alignment, with mean of max cosine similarities of 0.197). The mean coefficients of variation across randomly selected batches of 16 documents from each of these datasets were calculated, and the GPT-4 synthetic dataset had the lowest variation (174%), while MIMIC-IV had the highest (307%); Supplementary Table 2.
Performance across training strategies
Performance across different training strategies is shown as Figs. 1, 2 and Supplementary Tables 3, 4. Confusion matrices are available in Supplementary Tables 5, 6. Performance curves are available in Supplementary Figs. 1–12. Performance is reported on the validation dataset (10% of the original protected health information [PHI]-containing DFCI dataset) and on the held-out test dataset (10% of the original dataset).
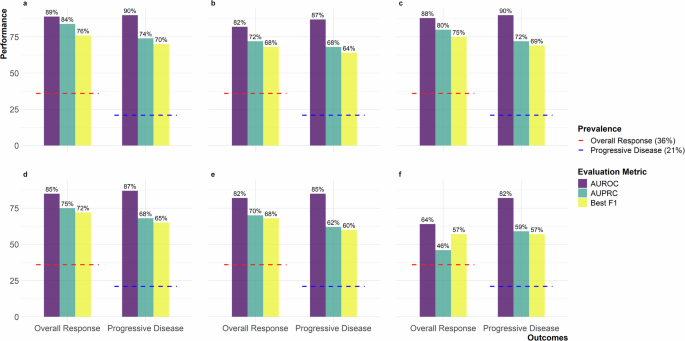
The validation set is sampled from the original PHI-containing DFCI dataset and is used during the training process to fine-tune hyperparameters and monitor model performance. The figure includes six panels representing experimental setups: a Teacher with temporal context, b Teacher without temporal context, c Teacher-Public Student (MIMIC-IV), d Teacher-Public Student (Wiki-text), e Teacher-GPT-4 Student, and f GPT-4 Student only. Metrics are shown with purple for AUROC, teal for AUPRC, and yellow for Best F1. Red dashed lines indicate 36% overall response prevalence, and blue dashed lines indicate 21% progressive disease prevalence. AUROC Area Under the Receiver Operating Characteristic Curve, AUPRC Area Under the Precision-Recall Curve, MIMIC-IV Medical Information Mart for Intensive Care IV, GPT-4 Generative Pre-trained Transformer 4.
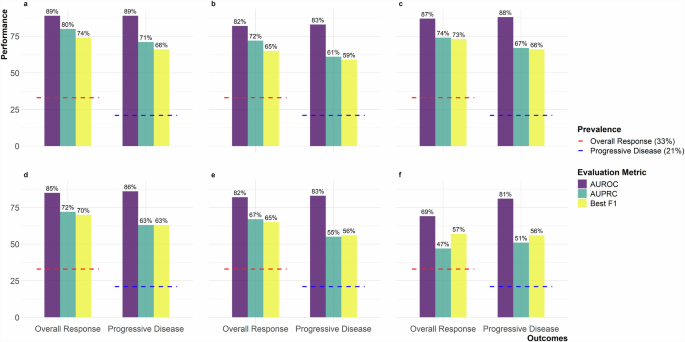
The held-out test set is sampled from the original PHI-containing DFCI dataset but is separate from the training and validation sets. It is used exclusively for evaluating the final performance of trained models. The figure includes six panels representing experimental setups: a Teacher with temporal context, b Teacher without temporal context, c Teacher-Public Student (MIMIC-IV), d Teacher-Public Student (Wiki-text), e Teacher-GPT-4 Student, and f GPT-4 Student only. Metrics are shown with purple for AUROC, teal for AUPRC, and yellow for Best F1. Red dashed lines indicate 33% overall response prevalence, and blue dashed lines indicate 21% progressive disease prevalence. AUROC Area Under the Receiver Operating Characteristic Curve, AUPRC Area Under the Precision-Recall Curve, MIMIC-IV Medical Information Mart for Intensive Care IV, GPT-4 Generative Pre-trained Transformer 4.
Teacher models trained on PHI-containing DFCI data
For the teacher model trained on PHI-containing DFCI data, the area under the receiver operating characteristic (AUROC) curve for overall response was 0.89 in both the validation and held-out test sets, with area under the precision-recall curve (AUPRC) of 0.84 and 0.80, and best F1 scores of 0.76 and 0.74 within the two subsets respectively (Supplementary Fig. 1). The results were similar for progressive disease, with an AUROC of 0.90 and 0.89, AUPRC of 0.74 and 0.71, and best F1 scores of 0.70 and 0.66, within the validation and held-out test sets, respectively (Supplementary Fig. 2).
With the exclusion of longitudinal temporal context, a decrease in performance was observed. For overall response, the AUROC was 0.82 in both sets, with AUPRC of 0.72 in both, and best F1 scores of 0.68 and 0.65 within the validation and held-out test sets, respectively (Supplementary Fig. 3). For progressive disease, the AUROC decreased to 0.87 and 0.83, with AUPRC of 0.68 and 0.61, and best F1 scores of 0.64 and 0.59 within the validation and held-out test sets, respectively (Supplementary Fig. 4).
Student models trained on MIMIC-IV data
For the student models trained on MIMIC imaging reports to predict labels assigned by the teacher models trained on PHI-containing DFCI data, the AUROC for ascertaining overall response from the original DFCI data was 0.88 and 0.87, with AUPRC of 0.80 and 0.74, and best F1 scores of 0.75 and 0.73 within the validation and held-out test sets, respectively (Supplementary Fig. 5). The results were consistent for progressive disease, with an AUROC of 0.90 and 0.88, AUPRC of 0.72 and 0.67, and best F1 scores of 0.69 and 0.66, within the validation and held-out test DFCI sets, respectively (Supplementary Fig. 6).
Student models trained on Wiki-text data
The performance of student models trained on Wiki-text data was modestly lower than performance of student models trained with MIMIC data. For overall response, the AUROC of the Wiki-text student model was 0.85 in the DFCI validation and test sets, with AUPRC of 0.75 and 0.72, and best F1 scores of 0.72 and 0.70 within the DFCI validation and held-out test sets respectively (Supplementary Fig. 7). For progressive disease, the AUROC was 0.87 and 0.86, with AUPRC of 0.68 and 0.63, and best F1 scores of 0.65 and 0.63 within the DFCI validation and held-out test sets, respectively (Supplementary Fig. 8).
Student models trained on matched-synthetic data from GPT-4
For student models trained on matched synthetic data from GPT-4 to predict labels assigned by the teacher model trained on PHI-containing DFCI data, the performance at extracting outcomes from DFCI data was comparable to training on Wiki-text data (Figs. 1, 2 and Supplementary Figs. 9, 10).
However, “student-only” models, exclusively trained on data generated by GPT-4 based only on sequences of true labels from our DFCI training data, exhibited the lowest performance. The AUROCs were 0.64 and 0.69, with AUPRC of 0.46 and 0.47, and best F1 scores of 0.72 for overall response within the DFCI validation and held-out test sets, respectively (Supplementary Fig. 11). For progressive disease, the AUROC was 0.82 and 0.81, with AUPRC of 0.59 and 0.51, and best F1-scores of 0.57 and 0.59 within the DFCI validation and held-out test sets, respectively (Supplementary Fig. 12).
The lower performance of the “student-only” model for overall response prompted a post-hoc error analysis, where the teacher model labeled the GPT-4 generated synthetic dataset, and its predictions were compared to the original seed labels. This yielded an AUROC of 0.94, AUPRC of 0.79, and a best F1 score of 0.84, indicating strong concordance between teacher model predictions and the labels used to prompt GPT-4 to generate text. However, the calibration curve deviated from the diagonal, with teacher-assigned predictions of response generally lower than the “true” seed labels in the mid-range of predicted probabilities (Supplementary Fig. 13). This suggests that GPT-4 sometimes generated imaging reports that did not meet the teacher model’s response criteria. Further analysis revealed that GPT-4 hallucinated missing sequences, occasionally producing unrealistic sequence of events, such as complete response following progressive disease. Still, even when the “student-only” model was re-trained on synthetic data restricted to observations with complete outcome sequences, performance remained consistent, with AUROC values of 0.68 and 0.69, AUPRC values of 0.51 and 0.47, and best F1 scores of 0.58 and 0.57 for the validation and held-out test sets, respectively. These findings, along with Wiki-text distillation results, highlight how model distillation can mitigate performance gaps caused by distribution mismatches between clinical inference datasets and synthetic or public training datasets.
Sensitivity analyses by demographics and cancer type
Overall, the pattern of results for demographic subgroups were consistent with the results for the overall population. Results for the held-out DFCI test set are reported here; detailed results for the DFCI validation and held-out tests are available in Supplementary Tables 7, 8. In the test set, teacher models trained on PHI-containing DFCI data demonstrated an AUROC ranging from 0.82 (non-White patients) to 0.95 (Hispanic patients) for overall response, and 0.83 (non-White patients) to 0.91 (Hispanic patients) for progressive disease. Teacher-informed student models trained on MIMIC-IV data performed similarly, with AUROC ranging from 0.81 (non-White patients) to 0.95 (Hispanic patients) for overall response, and 0.82 (non-White patients) to 0.91 (Hispanic patients) for progressive disease. For Wiki-text-trained models, performance was slightly lower, with AUROC ranging from 0.81 (non-White patients) to 0.93 (Hispanic patients) for overall response, and 0.79 (non-White patients) to 0.92 (Hispanic patients) for progressive disease. Models trained on GPT-4 synthetic data only exhibited the lowest performance, consistent with the full denominator in our study, with AUROC ranging from 0.67 (male patients) to 0.77 (Hispanic patients) for overall response, and 0.81 (non-White, male or female patients) to 0.90 (Hispanic patients) for progressive disease.
Likewise, the pattern of results for the five most common cancer types in dataset (breast, ovarian, non-small cell lung cancer, chronic lymphocytic leukemia, renal cell carcinoma) were consistent with the results for the overall population. Detailed results for the DFCI validation and held-out tests are available in Supplementary Tables 9, 10.
Differential privacy—stochastic gradient descent and the teacher model
Computational constraints restricted our training and inference on these longitudinal data to a batch size of 1, preventing ready implementation of off the shelf differential privacy—stochastic gradient descent (DP-SGD) methods16. However, we did confirm that injection of normally distributed noise into gradients during training of the progressive disease teacher model impaired model performance (Supplementary Figs. 14–16).
Vulnerability to membership inference attacks
In an unrealistic scenario in which an attacker has full access to private training and validation data, then trains an “attacker model” to predict whether a specific observation was in the training dataset, it was possible to derive moderately performant attack models (with AUROC scores of 0.61 for the teacher model and 0.60 for the teacher-trained-MIMIC-IV student model). However, in the more realistic scenario in which an attacker has access only to a teacher model and to in-domain data not included in training, using those data to train “shadow” attack models (Supplementary Fig. 17) yielded AUROC scores of 0.52 for the teacher model and 0.53 for the teacher-trained-MIMIC-IV student model.