
US stock markets have staged a sharp V-shaped rebound since the April low, with the Dow Jones Industrial Average up 16%, the S&P 500 climbing 22%, and the tech-heavy Nasdaq Composite surging 31%. The rally has been fuelled by risk-on sentiment following the Trump administration’s reversal on tariffs and a strong US earnings season, particularly among hyperscalers. A supportive macroeconomic environment has also underpinned the advance, with easing inflation, expectations of Fed rate cuts, and a broadly resilient US economy, even as early signs of slowing growth begin to emerge.
However, the recent rally may now be primed for a bout of profit-taking ahead of next week’s Federal Reserve meeting. Despite mounting political pressure from President Trump to ease monetary policy, the Fed is expected to take a cautious, gradual approach to cutting interest rates. Tariff-induced inflationary risks remain a key concern for the central bank. Although May’s CPI reading came in cooler than anticipated, inflation still sits above the Fed’s 2% target.
In addition, escalating geopolitical tensions could weigh further on risk assets. Israeli airstrikes on Iran sparked a sharp selloff in global stock markets during Friday’s Asian session. All three major US index futures fell significantly, with technology stocks leading the losses. Other risk-sensitive assets, including industrial metals and commodity-linked currencies, also declined, while crude oil prices spiked about 8% to a four-month high.
From a technical perspective, overbought conditions and emerging bearish divergence signals suggest a likely pullback in the major US indices. Meanwhile, I maintain a bullish view on the US dollar in the near term, as it regains its role as a haven asset amid rising geopolitical risk.
Bearish divergence emerges in the NasdaqChart 1 – Nasdaq 100 futures, daily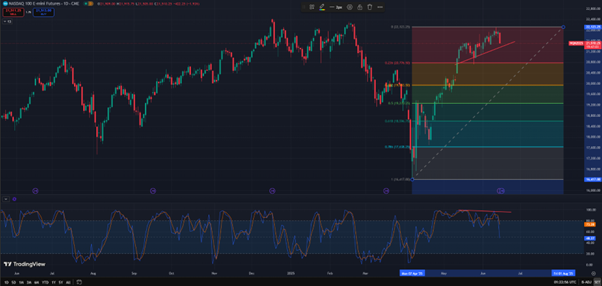
Source: TradingView as of 13 Jun 2025
A bearish divergence between the price and the stochastic trend has emerged in the Nasdaq 100, accompanied by overbought conditions. This indicates the potential for a deeper correction after the index’s more than 30% surge over the past two months. Immediate support lies at the 23.6% Fibonacci retracement level, which aligns with the 23 May low around 20,758. Further downside support may be found at the 38.2% retracement, around 19,933.
On the flip side, the recent high of 22,106 marks a key resistance level to the upside.
A bullish divergence emerges in DXYChart 2 – The US Dollar Index, daily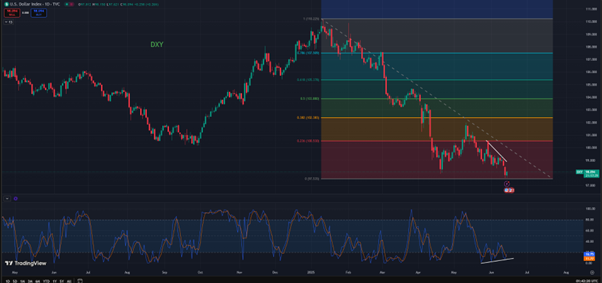
Source: TradingView as of 13 Jun 2025
A potential bullish divergence has appeared in the US dollar index (DXY), with the stochastic oscillator turning higher from oversold territory. Thursday’s low of 97.62 now acts as near-term support, while the immediate resistance stands at the 10 June high of 99.39. A possible double-bottom formation is also developing; if confirmed, it could see the DXY rebound above the psychological level of 100.
On the flip side, a break below the recent low could accelerate the dollar’s decline towards 95.