
Jun 15, 2025
IndexBox has just published a new report: EU – Fluorides, Fluorosilicates, Fluoroaluminates And Other Complex Fluorine Salts – Market Analysis, Forecast, Size, Trends And Insights.
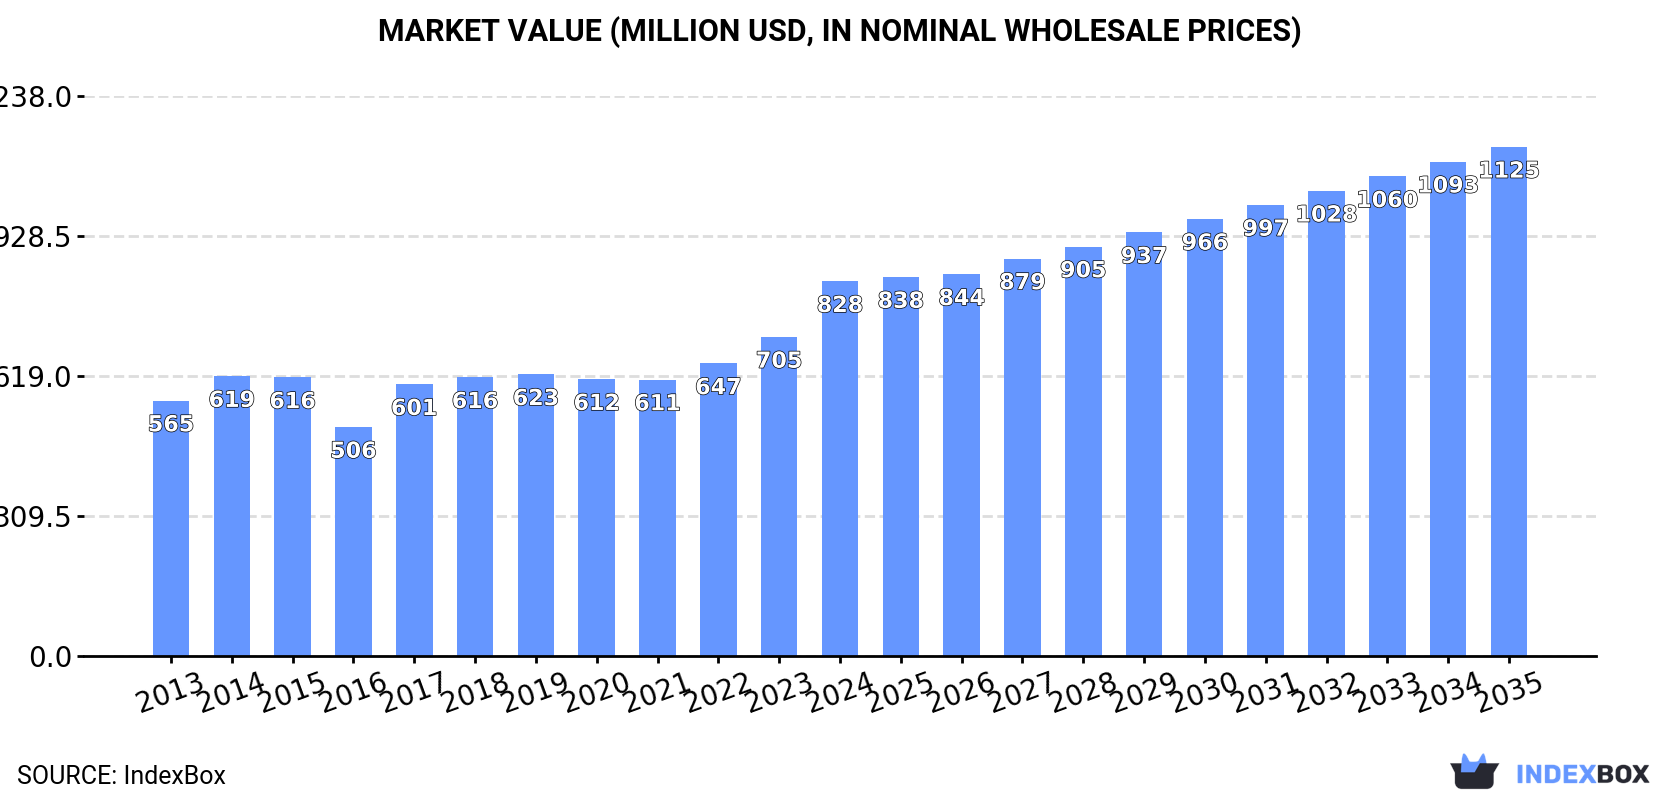
The European Union market for fluorides and complex fluorine salts is predicted to experience steady growth over the next decade, with market performance expected to accelerate. The market volume is forecasted to increase at a CAGR of +1.6% and reach 348K tons by 2035, while the market value is anticipated to grow at a CAGR of +2.8% and reach $1.1B by the same year.
Market Forecast
Driven by increasing demand for fluorides, fluorosilicates, fluoroaluminates and other complex fluorine salts in the European Union, the market is expected to continue an upward consumption trend over the next decade. Market performance is forecast to accelerate, expanding with an anticipated CAGR of +1.6% for the period from 2024 to 2035, which is projected to bring the market volume to 348K tons by the end of 2035.
In value terms, the market is forecast to increase with an anticipated CAGR of +2.8% for the period from 2024 to 2035, which is projected to bring the market value to $1.1B (in nominal wholesale prices) by the end of 2035.
 ConsumptionEuropean Union’s Consumption of Fluorides, Fluorosilicates, Fluoroaluminates And Other Complex Fluorine Salts
In 2024, consumption of fluorides, fluorosilicates, fluoroaluminates and other complex fluorine salts in the European Union declined to 291K tons, which is down by -8.2% against the previous year’s figure. Overall, consumption, however, continues to indicate a relatively flat trend pattern. The volume of consumption peaked at 317K tons in 2023, and then shrank in the following year.
The size of the complex fluorine salts market in the European Union surged to $828M in 2024, increasing by 17% against the previous year. This figure reflects the total revenues of producers and importers (excluding logistics costs, retail marketing costs, and retailers’ margins, which will be included in the final consumer price). The market value increased at an average annual rate of +3.5% from 2013 to 2024; the trend pattern indicated some noticeable fluctuations being recorded throughout the analyzed period. The level of consumption peaked in 2024 and is likely to continue growth in the immediate term.
Consumption By Country
The countries with the highest volumes of consumption in 2024 were Italy (109K tons), France (60K tons) and Spain (36K tons), with a combined 71% share of total consumption. Germany, the Netherlands, Hungary, Belgium, Bulgaria, Poland and Slovakia lagged somewhat behind, together comprising a further 23%.
From 2013 to 2024, the most notable rate of growth in terms of consumption, amongst the key consuming countries, was attained by Bulgaria (with a CAGR of +2.1%), while consumption for the other leaders experienced more modest paces of growth.
In value terms, the largest complex fluorine salts markets in the European Union were Italy ($288M), Germany ($191M) and France ($132M), together comprising 74% of the total market. Spain, Poland, Hungary, the Netherlands, Belgium, Slovakia and Bulgaria lagged somewhat behind, together comprising a further 21%.
Among the main consuming countries, Poland, with a CAGR of +8.4%, recorded the highest rates of growth with regard to market size over the period under review, while market for the other leaders experienced more modest paces of growth.
In 2024, the highest levels of complex fluorine salts per capita consumption was registered in Italy (1,854 kg per 1000 persons), followed by France (876 kg per 1000 persons), Hungary (873 kg per 1000 persons) and Slovakia (828 kg per 1000 persons), while the world average per capita consumption of complex fluorine salts was estimated at 653 kg per 1000 persons.
In Italy, complex fluorine salts per capita consumption remained relatively stable over the period from 2013-2024. In the other countries, the average annual rates were as follows: France (+1.1% per year) and Hungary (+2.0% per year).
ProductionEuropean Union’s Production of Fluorides, Fluorosilicates, Fluoroaluminates And Other Complex Fluorine Salts
In 2024, approx. 273K tons of fluorides, fluorosilicates, fluoroaluminates and other complex fluorine salts were produced in the European Union; which is down by -5.1% against the year before. Overall, production continues to indicate a relatively flat trend pattern. The most prominent rate of growth was recorded in 2017 with an increase of 23%. The volume of production peaked at 294K tons in 2014; however, from 2015 to 2024, production stood at a somewhat lower figure.
In value terms, complex fluorine salts production surged to $849M in 2024 estimated in export price. The total output value increased at an average annual rate of +3.9% over the period from 2013 to 2024; the trend pattern indicated some noticeable fluctuations being recorded in certain years. As a result, production attained the peak level and is likely to continue growth in the immediate term.
Production By Country
Italy (116K tons) remains the largest complex fluorine salts producing country in the European Union, accounting for 42% of total volume. Moreover, complex fluorine salts production in Italy exceeded the figures recorded by the second-largest producer, France (55K tons), twofold. Spain (33K tons) ranked third in terms of total production with a 12% share.
From 2013 to 2024, the average annual growth rate of volume in Italy was relatively modest. In the other countries, the average annual rates were as follows: France (+3.3% per year) and Spain (+0.1% per year).
ImportsEuropean Union’s Imports of Fluorides, Fluorosilicates, Fluoroaluminates And Other Complex Fluorine Salts
For the third consecutive year, the European Union recorded decline in purchases abroad of fluorides, fluorosilicates, fluoroaluminates and other complex fluorine salts, which decreased by -14.7% to 66K tons in 2024. In general, imports continue to indicate a mild decline. The pace of growth appeared the most rapid in 2021 when imports increased by 19% against the previous year. As a result, imports reached the peak of 106K tons. From 2022 to 2024, the growth of imports remained at a lower figure.
In value terms, complex fluorine salts imports contracted remarkably to $202M in 2024. Overall, imports, however, saw a noticeable expansion. The growth pace was the most rapid in 2022 with an increase of 47%. Over the period under review, imports attained the peak figure at $294M in 2023, and then shrank rapidly in the following year.
Imports By Country
In 2024, the Netherlands (15K tons), distantly followed by Spain (8K tons), Germany (7.3K tons), France (6.9K tons), Poland (4.7K tons), Italy (3.9K tons) and Greece (3.9K tons) were the key importers of fluorides, fluorosilicates, fluoroaluminates and other complex fluorine salts, together generating 76% of total imports. Hungary (2.3K tons), Sweden (2.1K tons) and Slovenia (2K tons) followed a long way behind the leaders.
From 2013 to 2024, the biggest increases were recorded for Greece (with a CAGR of +11.8%), while purchases for the other leaders experienced more modest paces of growth.
In value terms, the largest complex fluorine salts importing markets in the European Union were Poland ($42M), Germany ($23M) and the Netherlands ($20M), together comprising 42% of total imports. Hungary, France, Slovenia, Spain, Italy, Greece and Sweden lagged somewhat behind, together accounting for a further 44%.
In terms of the main importing countries, Hungary, with a CAGR of +31.8%, saw the highest growth rate of the value of imports, over the period under review, while purchases for the other leaders experienced more modest paces of growth.
Import Prices By Country
The import price in the European Union stood at $3,057 per ton in 2024, which is down by -19.7% against the previous year. Over the period under review, the import price, however, showed a remarkable increase. The most prominent rate of growth was recorded in 2022 when the import price increased by 62% against the previous year. The level of import peaked at $3,805 per ton in 2023, and then declined notably in the following year.
Prices varied noticeably by country of destination: amid the top importers, the country with the highest price was Poland ($8,773 per ton), while the Netherlands ($1,343 per ton) was amongst the lowest.
From 2013 to 2024, the most notable rate of growth in terms of prices was attained by Hungary (+30.5%), while the other leaders experienced more modest paces of growth.
ExportsEuropean Union’s Exports of Fluorides, Fluorosilicates, Fluoroaluminates And Other Complex Fluorine Salts
In 2024, shipments abroad of fluorides, fluorosilicates, fluoroaluminates and other complex fluorine salts decreased by less than 0.1% to 48K tons, falling for the third year in a row after two years of growth. Over the period under review, exports showed a abrupt setback. The most prominent rate of growth was recorded in 2021 with an increase of 15% against the previous year. As a result, the exports reached the peak of 95K tons. From 2022 to 2024, the growth of the exports remained at a lower figure.
In value terms, complex fluorine salts exports skyrocketed to $190M in 2024. The total export value increased at an average annual rate of +2.7% over the period from 2013 to 2024; however, the trend pattern remained consistent, with only minor fluctuations throughout the analyzed period. The growth pace was the most rapid in 2021 when exports increased by 25% against the previous year. Over the period under review, the exports reached the maximum in 2024 and are likely to continue growth in the immediate term.
Exports By Country
The shipments of the five major exporters of fluorides, fluorosilicates, fluoroaluminates and other complex fluorine salts, namely Italy, Belgium, the Netherlands, Germany and Spain, represented more than two-thirds of total export. It was distantly followed by France (2.6K tons), achieving a 5.5% share of total exports. Hungary (1.4K tons) followed a long way behind the leaders.
From 2013 to 2024, the biggest increases were recorded for Italy (with a CAGR of +23.5%), while shipments for the other leaders experienced mixed trends in the exports figures.
In value terms, Germany ($114M) remains the largest complex fluorine salts supplier in the European Union, comprising 60% of total exports. The second position in the ranking was held by Belgium ($20M), with an 11% share of total exports. It was followed by the Netherlands, with a 4.8% share.
From 2013 to 2024, the average annual rate of growth in terms of value in Germany totaled +7.1%. In the other countries, the average annual rates were as follows: Belgium (+0.8% per year) and the Netherlands (-5.7% per year).
Export Prices By Country
In 2024, the export price in the European Union amounted to $3,945 per ton, picking up by 24% against the previous year. Over the period under review, the export price continues to indicate a remarkable increase. The most prominent rate of growth was recorded in 2023 when the export price increased by 64% against the previous year. Over the period under review, the export prices attained the maximum in 2024 and is expected to retain growth in years to come.
Prices varied noticeably by country of origin: amid the top suppliers, the country with the highest price was Germany ($17,495 per ton), while Italy ($195 per ton) was amongst the lowest.
From 2013 to 2024, the most notable rate of growth in terms of prices was attained by Germany (+14.4%), while the other leaders experienced more modest paces of growth.
Source: IndexBox Market Intelligence Platform